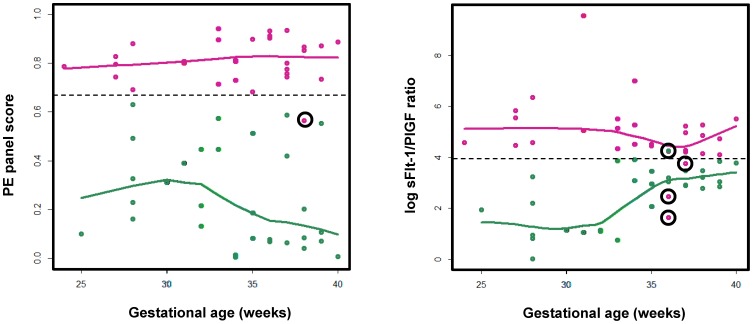
Figure 4. Diagnosis of PE from control with serum biomarkers.
Left panel: estimated PE scores were computed from the PE serum peptide panel PAM model as a function of the gestational weeks; right panel: the log sFlt-1/PIGF serum concentration ratio was plotted as a function of the gestational weeks. Red indicates known PE cases; green indicates known healthy pregnancy controls. For either PE or control sample category, a loess curve was fitted to represent the overall trend of biomarker scoring as a function of gestational age.

