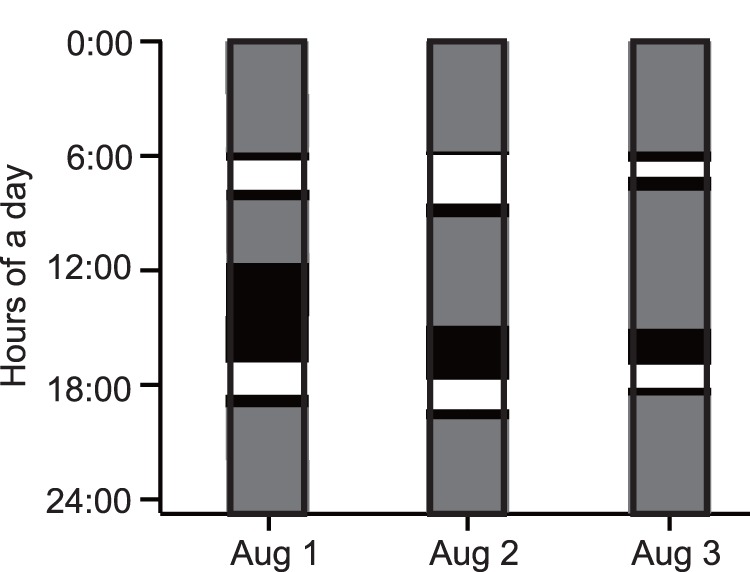
Figure 5. Daily ethogram of an immature green turtle (CM5) over 3 days.

The ethogram consists of three phases, feeding (white), resting (grey) and other (black), which were defined from the depth data (see Materials and Methods).

The ethogram consists of three phases, feeding (white), resting (grey) and other (black), which were defined from the depth data (see Materials and Methods).