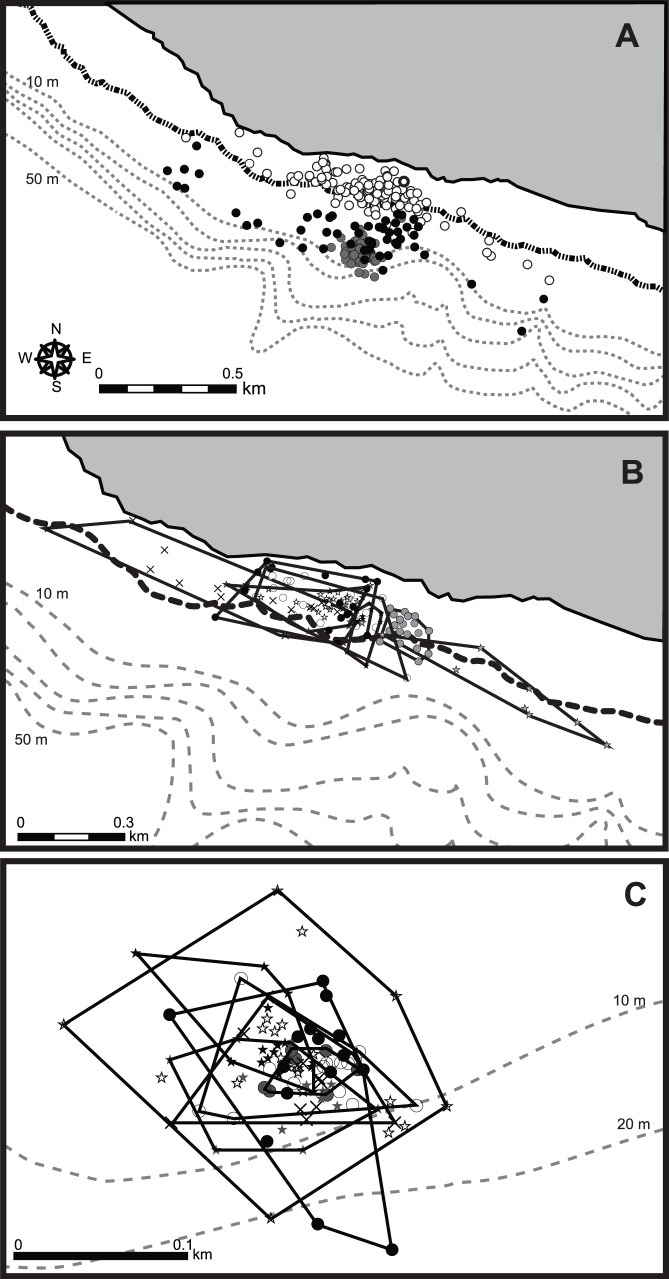
Figure 8. GPS locations for an immature green turtle (CM5) during three phases.
(A) feeding (white), resting (grey) and other phases (black). Black and grey dotted lines represent the low-tide and 10 m interval depth contour lines, respectively. GPS locations during (B) feeding and (C) resting phases. Symbols and solid lines represent each phase and its area within a 100% minimum convex polygon.

