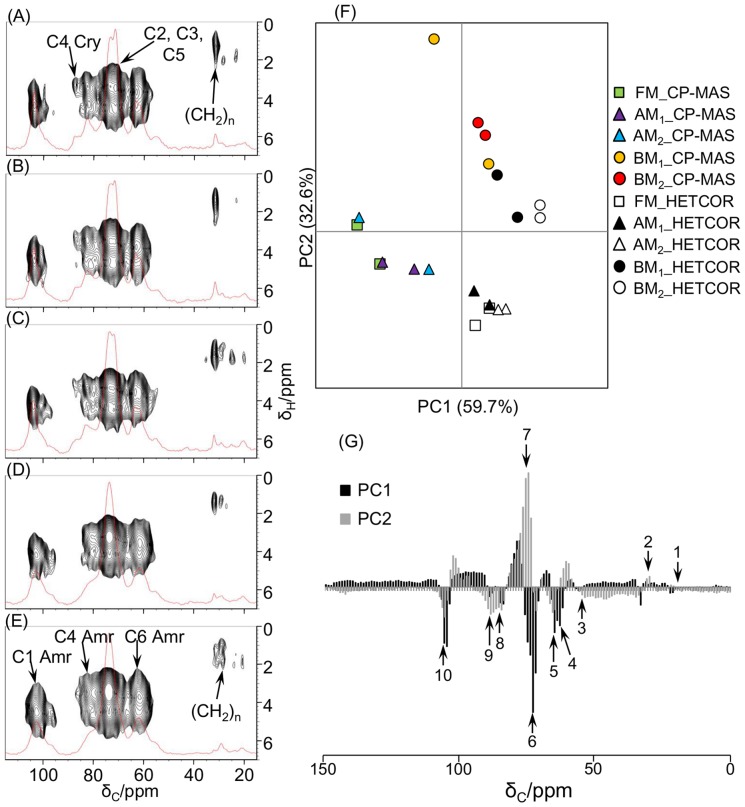
Figure 3. Structural characterization of biomass under different milling processes using NMR spectroscopy.
13C CP-MAS and 13C-1H HETCOR NMR spectra of FM- (A), AM1- (B), AM2- (C), BM1- (D), and BM2-processed samples (E). The contact time was set to 1.0 ms for CP-MAS spectra. Characteristics of the biomass structure of each sample: PCA score plot (F) and loading plot (G) of 13C CP-MAS and digitized 1D 13C-1H HETCOR spectra. C1–C6, position of cellulose carbon; cry, crystalline cellulose; amr, amorphous cellulose; 1, CH3 in hemicellulose; 2, aliphatic –(CH2)n–; 3, OCH3 of lignin; 4, CH2OH of carbohydrates (C6 of amorphous cellulose); 5, CH2OH of carbohydrates (C6 of crystalline cellulose); 6 and 7, CHOH of carbohydrates (C2, C3, and C5 of cellulose); 8, CHOH of carbohydrates (C4 of amorphous cellulose); 9, CHOH of carbohydrates (C4 of crystalline cellulose); 10, OCHO of carbohydrates (C1 of cellulose).

