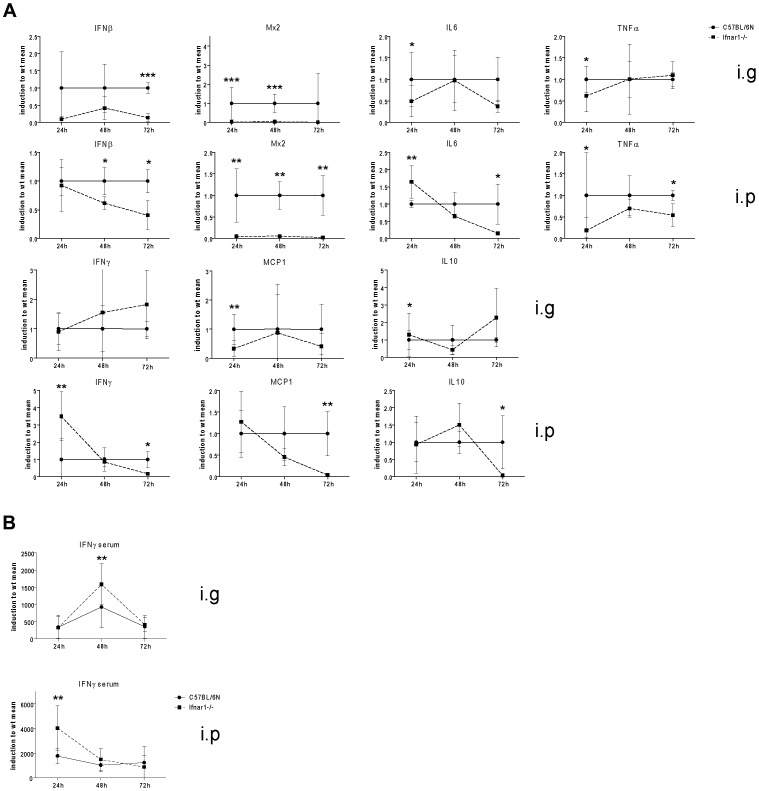
Figure 8. Delayed cytokine response in Ifnar1−/− compared to Wt mice after intragastric infection with Listeria monocytogenes.
A.Cytokine mRNA expression in the spleens of C57BL/6N (solid line) or Ifnar1−/− mice (hatched line) 24 h, 48 h and 72 h after infection with 5×10∧9 CFU of strain LO28InlA* by intragastric gavage (i.g.), or 1×10∧6 LO28InlA* by intraperitoneal infection (i.p.) was determined by qPCR. mRNAs were normalized to the GAPDH housekeeping control and values obtained from infected Wt mice set to 1. Data from Ifnar1−/− mice thus represent the relative induction compared to the value obtained at the same time point from Wt animals. Mean values and SEM from 9 mice (spleen, all time points of i.g. infection), 7 mice (spleen after 24 h of i.p. infection) or 4 mice (spleen, 48 h and 72 h after i.p. infection) are indicated. B. Serum IFNγ levels of C57BL/6N Wt and Ifnar1−/− mice infected i.g. for 24 h, 48 h or 72 h with 5×10∧9 CFU of strain LO28InlA* by intragastric gavage (i.g.), or with 1×10∧6 CFU LO28InlA* by intraperitoneal injection were determined using a flow cytometry-based bead array. Mean values and SEM from 9 mice (24 h and 48 h time points) or 12 mice (72 h time point) are indicated.

