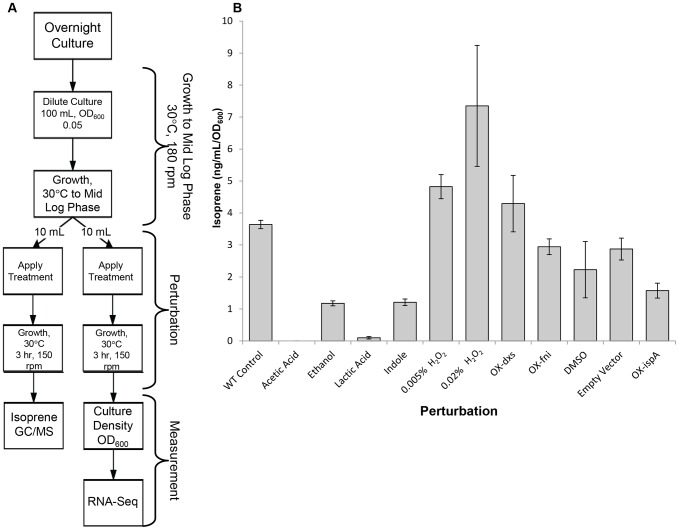
Figure 1. Quantitation of isoprene production under diverse experimental perturbations inB. subtilis.
Flow chart of the perturbation and sampling protocols. Details are provided in Materials and Methods. B, The isoprene concentrations in the headspace were determined by GC-MS. “OX” represents genetic perturbations in which the listed gene was overexpressed. Bars indicate the mean and error bars indicate standard deviation from the mean.

