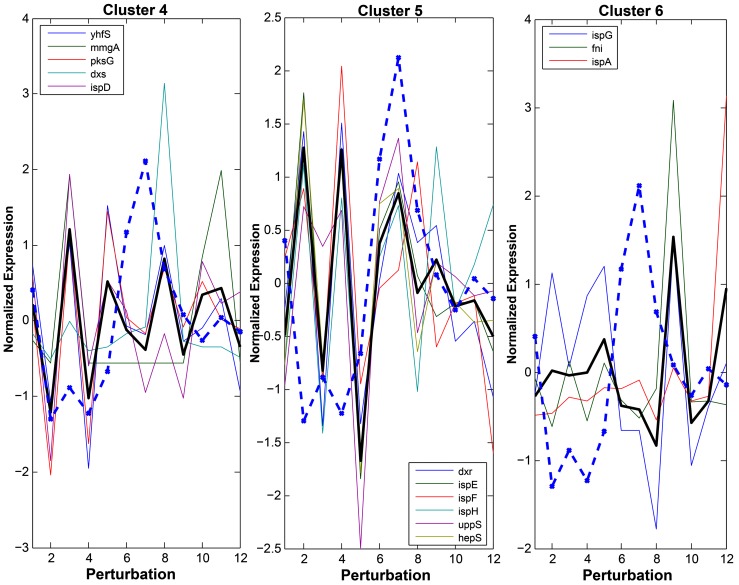
Figure 4. The terpenoid genes cluster into their main groups with respect to coexpression and isoprene production; covariance is dependent upon the type of perturbation.
Genes were clustered using k-means. The normalized isoprene production level is represented by the dashed blue line and the mean expression for each cluster is represented by the solid black line in each cluster. The legend in each of the three panels indicates the name of the genes in each cluster. The mRNA levels are normalized (z-score) for each gene. The x-axis is representative of the perturbations as follows (1 through 12): wild type control, acetic acid, ethanol, lactic acid, indole, 0.005% H2O2, 0.02% H2O2, OX-dxs, OX-fni, DMSO, empty vector, and OX-ispA.

