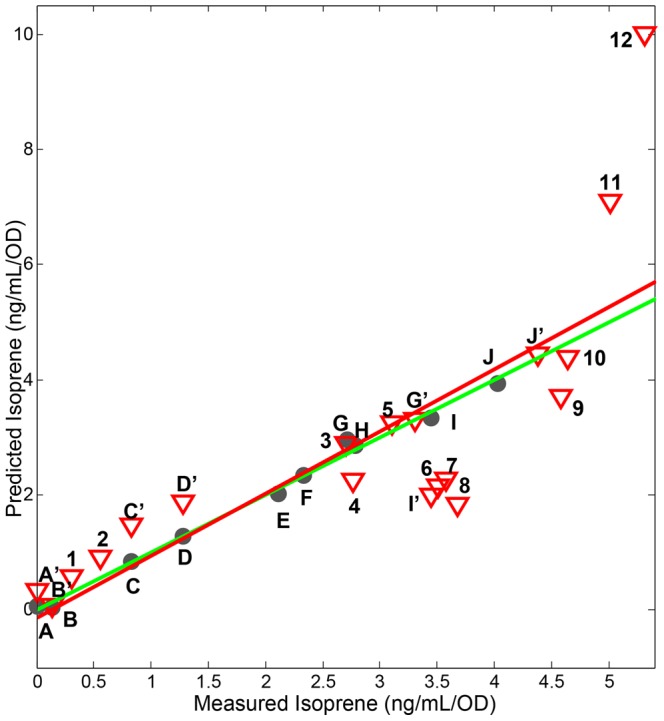
Figure 7. Isoprene production induced by perturbations can be predicted by a PLSR model based on a reduced transcriptome.

The model was created using 213 genes and trained using ten perturbations with cross validation. The green line is the fit for the training data set; the red line is the fit for the testing data set. The R2 value for prediction of the test set is 0.64. Closed circles are representative of training set values that are labeled A through J; the red triangles are the test set conditions, the test set conditions that are identical to the training set conditions are labeled A’ through J’. Unique conditions in the training set are labeled numerically 1 through 12. Perturbation abbreviations: A and A’, 2% acetic acid; B and B’, 2% lactic acid; C and C’, 1% ethanol; D and D’, 0.2 mg/mL indole; E, DMSO; F, OX-ispA; G and G’, OX-fni, H, empty vector; I and I’, wild type control; J and J’, OX-dxs; 1, 0.2% acetic acid; 2, 0.2% lactic acid; 3, 0.02 mg/mL indole; 4, 0.1% ethanol; 5, 0.2% xylose; 6, 0.2% mannose; 7, 0.2% glucose; 8, 0.3 M NaCl; 9, OX-dxsdxr; 10, OX-dxsfni; 11, 0.005% H2O2; 12, 0.02% H2O2.
