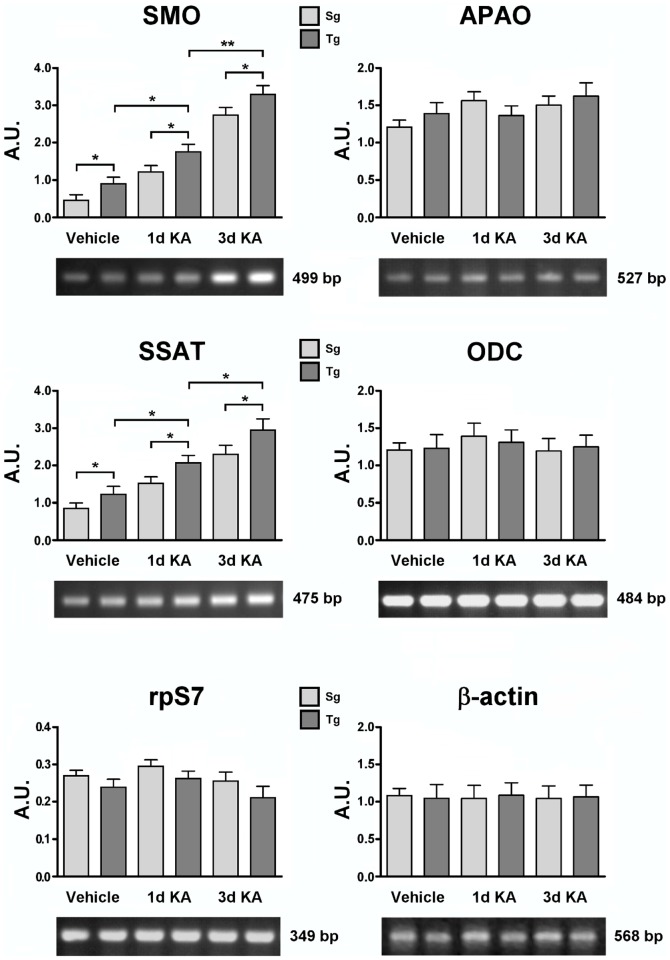
Figure 9. SMO, APAO, ODC and SSAT transcript level analyses of KA treated Tg and Sg mice.
SMO, APAO, ODC and SSAT transcript accumulation of 3 months old mice were analyzed after 1 and 3 days of KA treatment. Representative RT-PCR experiments from three independent replicas are shown. Densitometric analyses of PCR gel bands, represent the measurements done on three separate experiments. The β-actin and/or rpS7 gene expression was used for normalization. An arbitrary densitometric unit bar graph (A.U.) is shown. The p values were measured with the two-way ANOVA test and post-hoc test Bonferroni (*, p<0.05; **, p<0.01). Sg, syngenic mice; Tg, transgenic mice.

