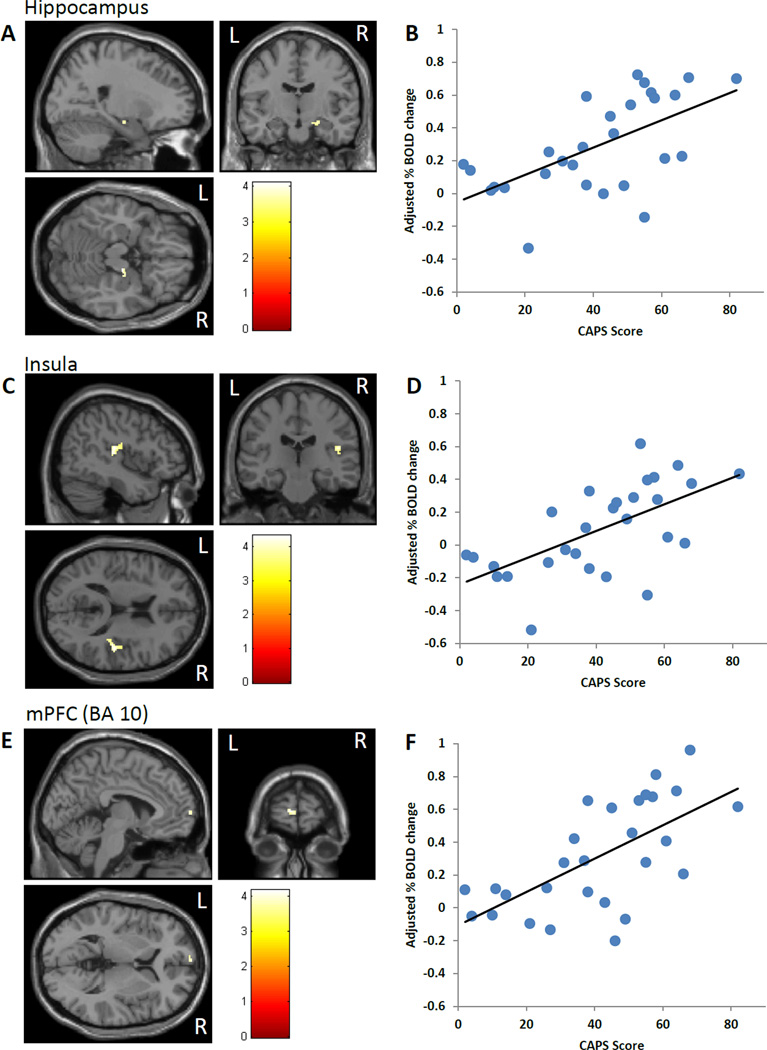
Figure 2.
CAPS correlations for angry-shape contrast. CAPS scores (past month) were positively correlated with activation in the hippocampus (A, B), insula (C, D), and mPFC (E, F). Activation images are shown for each brain region (A, C, E) along with partial plots of the extracted percent BOLD signal change for each cluster vs. CAPS scores (B, D, F). Results were covaried for depressive symptoms and IQ. CAPS=Clinician Administered PTSD Scale.

