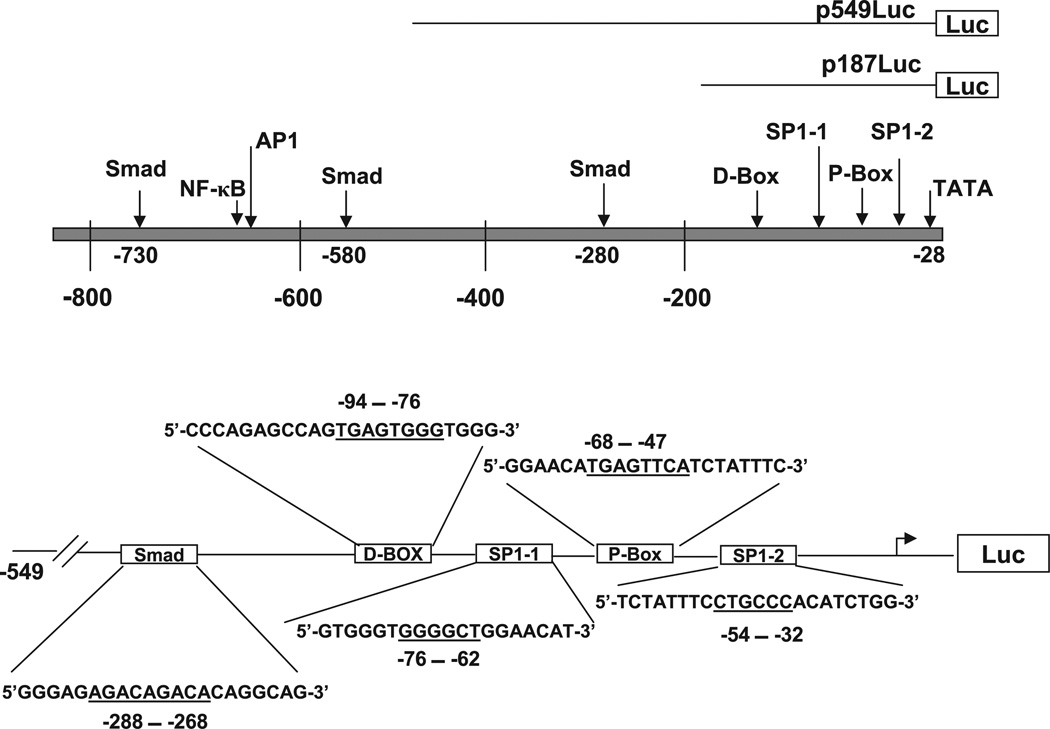
Fig. 1.
Schematic representation of the promoter region of human plasminogen activator inhibitor type 1 (PAI-1) gene. The top represents the promoter region up to − 800 bp. The arrows indicate the transcription factor binding sites in the promoter region, based on the published sequences (7, 8, 10, 21, 22, 32). D-Box and P-Box contain AP-1-like cis elements. The bottom illustrates major transcription factor binding sites in p549Luc construct. The boxes represent the locations of the transcription factor binding sites, and the sequences are the decoy oligonucleotides (ODNs) that are used in the study. The underlined sequences represent the binding sites of transcription factors (22).

