
Figure 5.
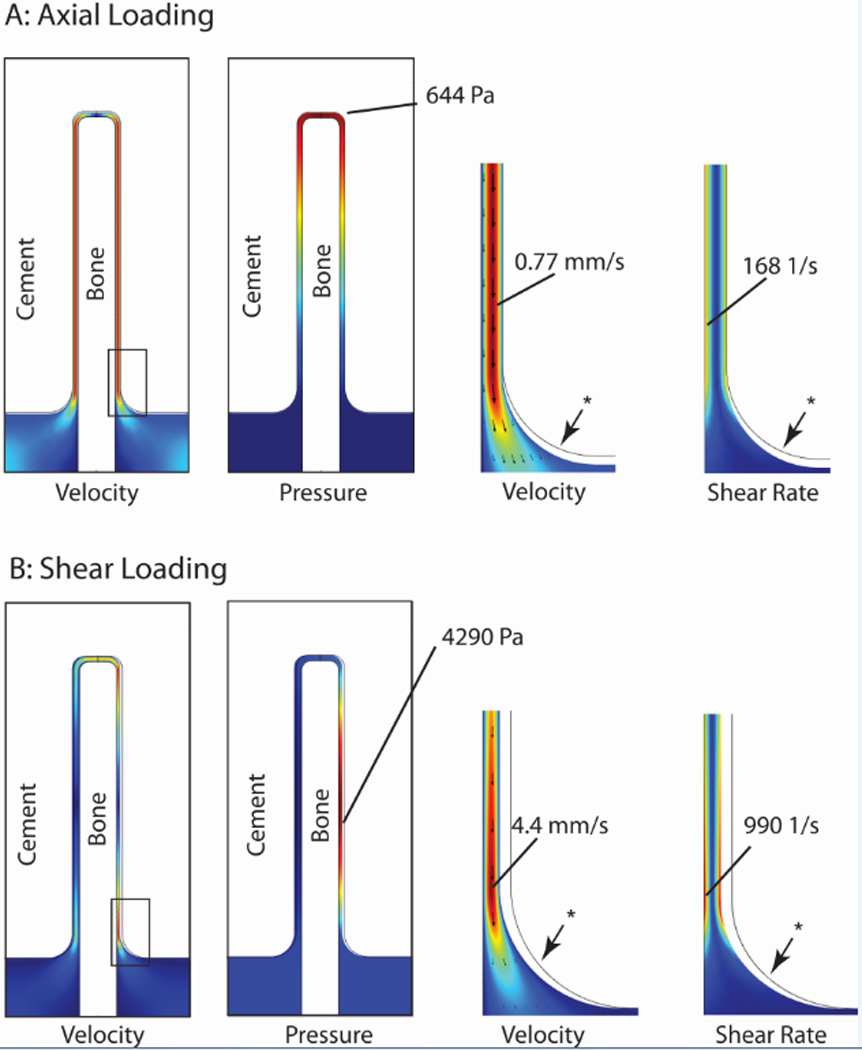
Fluid velocity, pressure, and shear rate at 0.25 s for axial (A) and shear loading (B) conditions with an 80% gap closing fraction, loading frequency of 1 Hz, and 0.1 Pa-s fluid viscosity. Red represents highest magnitudes, while dark blue represents 0 magnitude. * indicates undeformed position of fluid-cement interface.