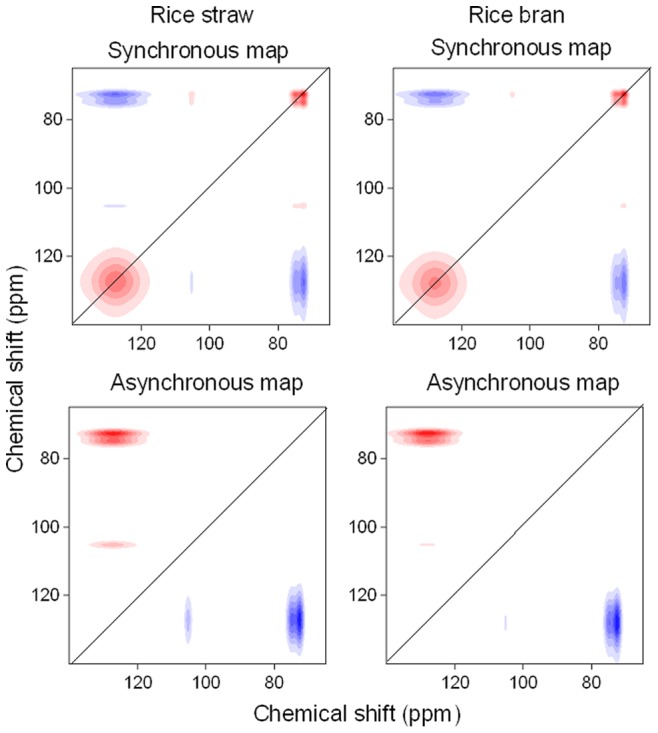
Figure 3. Synchronous and asynchronous 2D 13C NMR maps of rice straw and rice bran derived biochars over charring temperatures (100∼600°C).

Red represents positive correlation, and blue represents negative correlation; a higher color intensity indicates a stronger positive or negative correlation.
