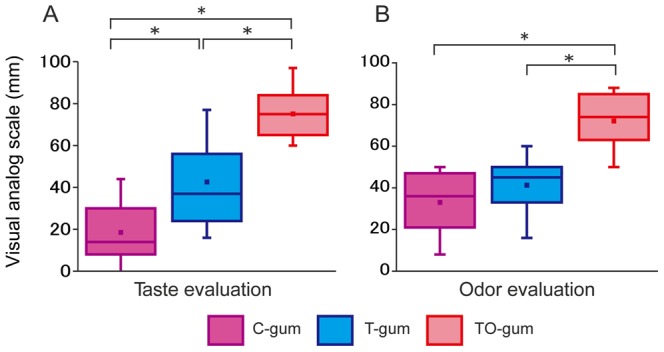
Figure 1. Summaries of Visual Analog Scales (VAS) of taste (A) and odor (B) of tested gums (N = 25).

Each scale ranged from 0 (worst) to 100 (best). The boxes are constructed with the top line bounding the first-quartile and the bottom line bounding the third quartile. The horizontal line and the dot in the box indicate the median and mean values, respectively. The short horizontal lines show the largest and smallest values. **P<0.01, ***P<0.001. C-gum (purple): the gum with no taste and no odor (control), T-gum (blue): the gum with the sweet taste only, and TO-gum (red): the gum with sweet taste and lemon odor.
