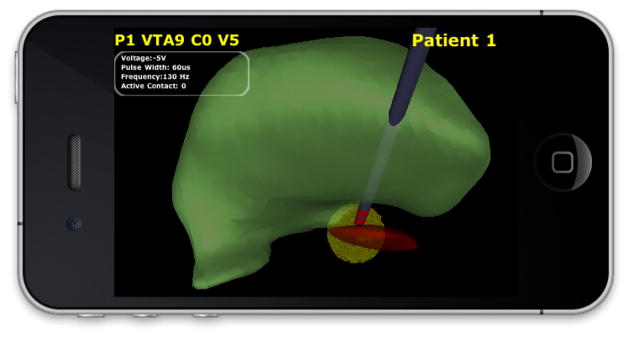
Fig. 1.

A patient-specific model of deep brain stimulation (DBS) is used to show the location of the electrode lead relative to the surrounding nuclei in a Parkinson’s disease patient. A model-predicted volume of tissue activated (VTA) during DBS (yellow part) is shown surrounding the distal electrode contact. With this model it is possible to view the overlap between the VTA and nearby anatomical structures, which is a key feature in clinical decision making when choosing stimulation settings.
