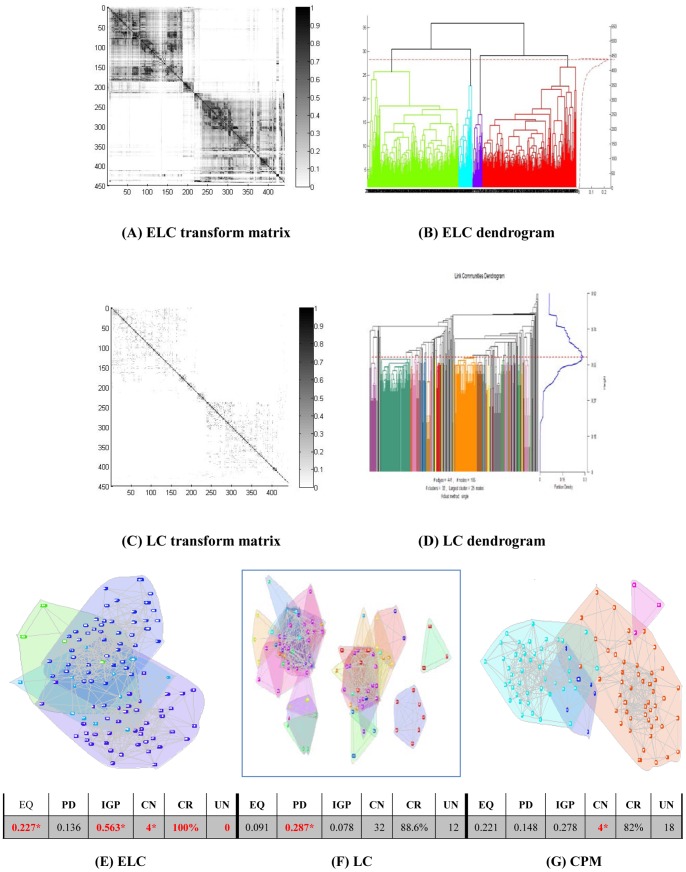
Figure 5. US politics network (105 nodes/3 classes).
The transform matrix (A) and the dendrogram (B) obtained by ELC, the transform matrix (C) and the dendrogram (D) obtained by LC. (E–G) Communities and corresponding values of Extended Quality of modularity (EQ), Partition Density (PD), In-Group-Proportion (IGP), Communities Number (CN), Cover Rate (CR) and number of Uncovered Nodes (UN) obtained by ELC, LC and CPM. *the red and bold data marked with an asterisk (*) is the best value of each evaluation on the dataset for the three methods.

