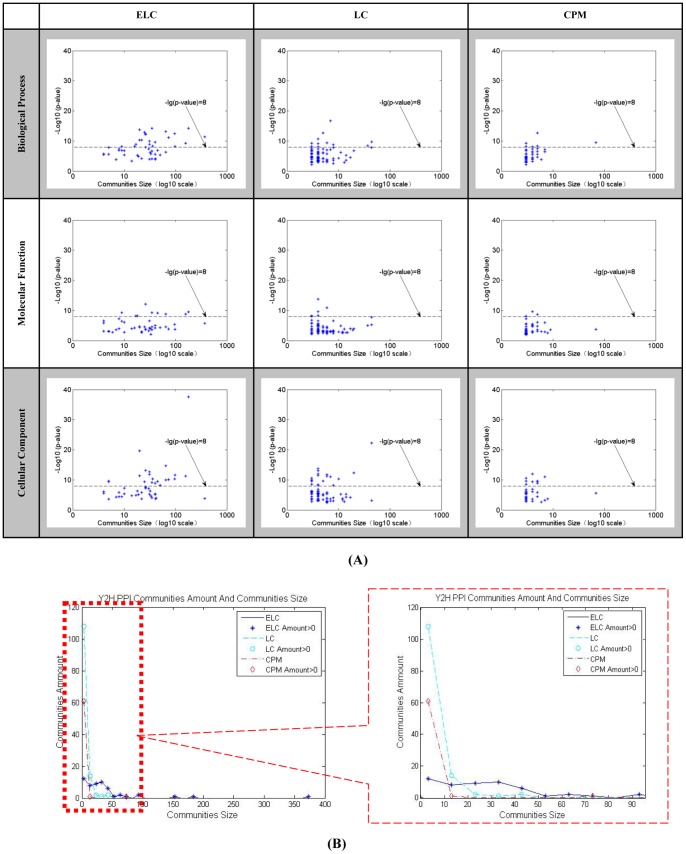
Figure 8. Y2H network for GO enrichment analysis.
(A) Y2H network’s community numbers and GO enrichment values obtained by ELC, LC and CPM. Axis x is log10 community numbers and axis y is –log10 p-values of all modules GO enrichment for biological process, molecular functions and cellular component. The average communities size found by ELC are much higher than LC and CPM by GO categories at smaller p-value level, especially when p-values are lower than E-8. (B) Y2H network’s statistics on nodes number of communities by ELC, LC and CPM.

