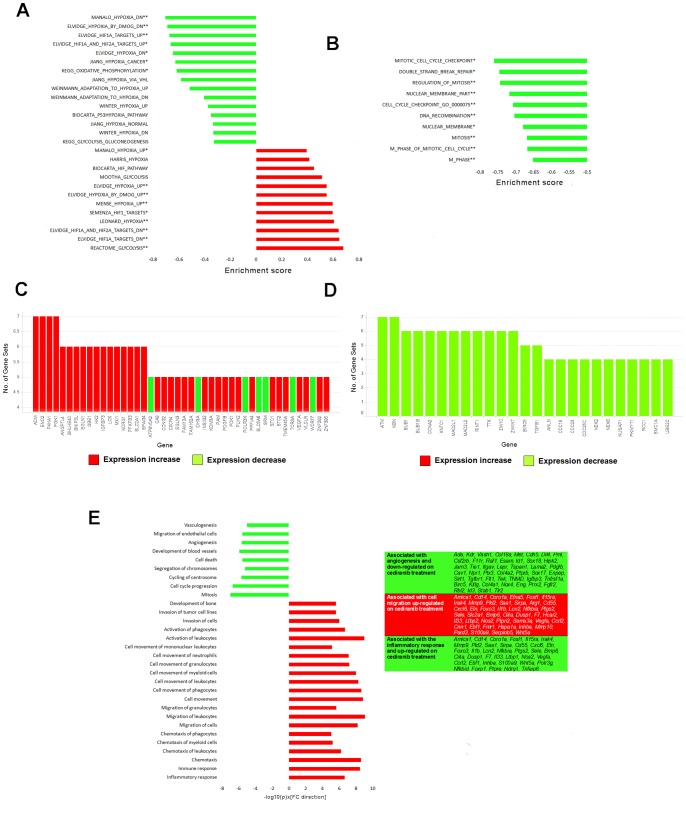
Figure 4. RNA-Seq differentiates the tumour (human) transcriptional response to cediranib from the host (mouse).
Gene Set Enrichment Analysis (GSEA) reveals significant enrichment of (A) hypoxia and (B) cell cycle associated signatures in tumour genes differentially regulated in response to cediranib dosed at 6 mg/kg once daily for 4 days (** indicates gene sets enriched with p<0.001, FDR q<0.05 and FWER p<0.1; * indicates gene sets enriched with p<0.001 and FDR q<0.05). GSEA-defined “Leading Edge” genes most frequently included in (C) hypoxia-associated gene sets and up-regulated in response to cediranib include CA9, HK2 and VEGFA. Leading edge cell cycle associated genes are given in (D). (E) Ingenuity Pathway Analysis (IPA) highlights functions significantly enriched (p<1×10⁻⁵) amongst host genes differentially regulated in response to cediranib. For both GSEA and IPA, genes achieving a log2 fold change magnitude>1 and p<0.1 were defined as differentially regulated. n = 2 in treated and control groups; a positive fold change indicates genes up-regulated in response to cediranib, and vice versa.

