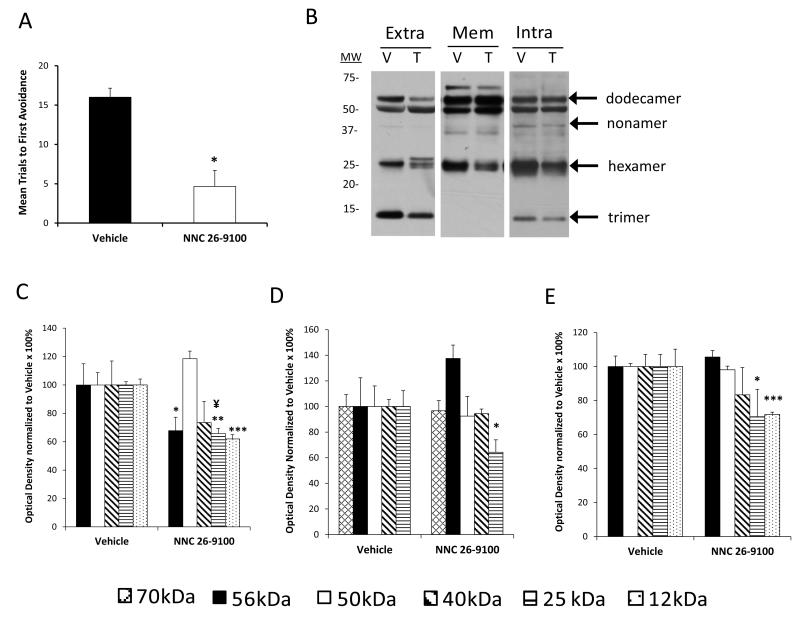
Figure-6.
(A) Acquisition learning of APPswe Tg2576 mice was evaluated using the T-maze task following i.c.v. injection of 0.2 μg NNC 26-9100 (T) or vehicle (V) (n = 3-4/group). (B) Representative Western blot of soluble oligomeric Aβ42 forms extracted from extracellular (Extra), membrane (Mem), and intracellular (Intra) fractions (cortical tissue). Bar graphs of Aβ42 forms identified within (C) extracellular, (D) membrane, and (E) intracellular fractions. Optical densities normalized to respective vehicles. *p < 0.05; ** p < 0.01; *** p < 0.001 (Student’s T-test), values are mean ± S.E.M. ¥ indicates delineated split of the 25 kDa band with NNC 26-9100 treatment.

