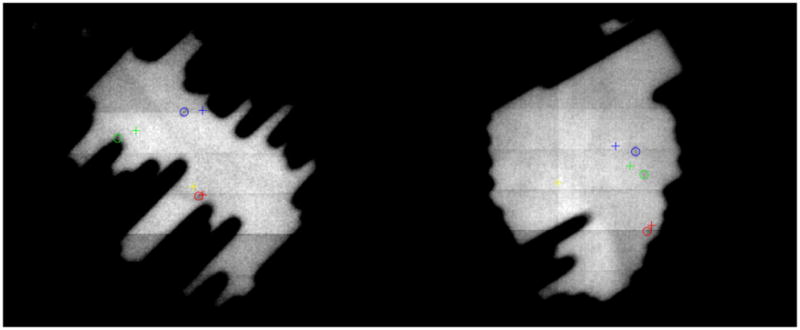
Figure 1.

Detection of the three fiducials on EPID MV images. The CT planned positions of the fiducials are depicted by crosses and the localized positions with circles. Left: In this challenging situation in which the fiducials are close to the leaf edges for this leaves configuration, the algorithm is able to successfully detect several mm of displacement detected for fiducials 1 (blue) and 2 (green). Fiducial 3 is displayed in red and the projection of the isocenter is represented by the yellow cross. This patient’s motion statistics are summarized in case 7 in the data Tables. The whole motion trajectory is showed in Figure 3, row 4. The gantry angle for this image is 221.6 degrees. Right: This image corresponds to the motion depicted in Fig. 3, row 5 (overall statistics for all fractions in case 2 in the Tables). The gantry angle is 99.9 degrees. A gantry angle of 0 degrees corresponds to an anterior-posterior beam and the gantry angle increases in the clockwise direction.
