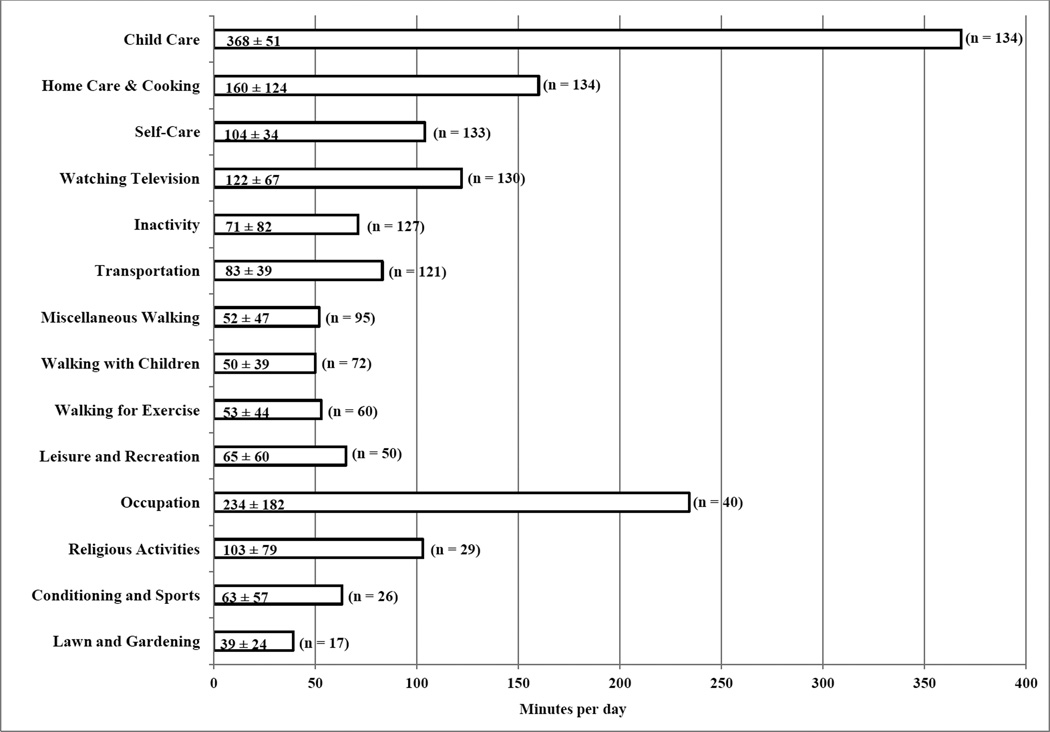
Figure 1.
Means and standard deviations for minutes per day spent in physical activities recorded in the baseline physical activity records. Categories were created from activity codes listed in the 2011 Compendium of Physical Activities [3]. Time is rounded to the nearest minute. The maximum sample size is 134 as five participants did not have 3 or more days of the PAR. The number in the parentheses reflects the participants reporting the activity.

