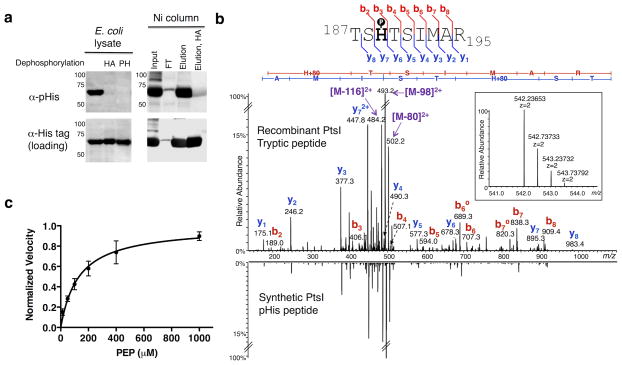
Figure 4. Analysis of histidine phosphorylation on PtsI.
a) Western blots of E. coli lysates expressing His6-tagged PtsI. Left: α-pHis blot of crude lysates and those treated with hydroxylamine (HA) or phosphohistidine phosphatase (PH). Right: Crude lysates were purified over Ni-NTA beads and the indicated fractions probed with the α-pHis antibody. As loading controls, the membranes were stripped and re-blotted with an α-His-tag antibody. See Supplementary Fig. 20 for full Western blots. b) Overexpressed PtsI was digested with trypsin and analyzed by high-resolution nano-UPLC-MS. Shown is the MS/MS spectrum from the tryptic peptide ion bearing pHis at the canonical His-189 site, with the matched b- and y- ions indicated in the spectrum and in the sequence flag diagram above (inset: MS spectrum of the precursor ion species, including its accurate mass measurement). For comparison, the MS/MS spectrum of a synthetic version of the pHis-bearing peptide is shown in mirror image below. c) A dot blot assay was developed to measure the kinetics of autophosphorylation of PtsI by PEP. A plot of the reaction velocity as a function of PEP concentration was used to determine an apparent Km value of 135 ± 30 μM (n = 3, mean ± s.d.).

