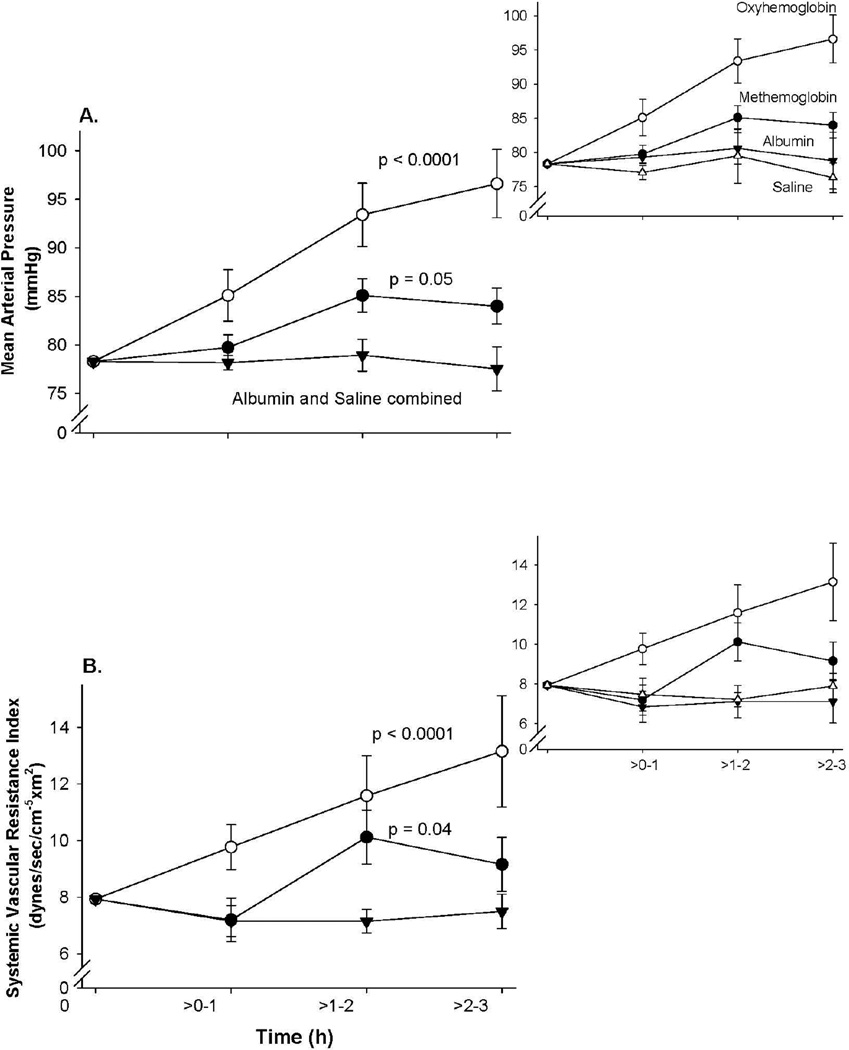
Figure 1. Changes in MAP and SVRI.
Serial mean (± SE) changes in (A) MAP, (B) SVRI in animals receiving oxyHb (n=5), metHb (n=5), albumin (n=5), or saline (n=5) are plotted. Hemodynamic values are plotted from a common origin representing the mean values for all animals at time 0. The inset above and to the right shows the individual serial changes for albumin and saline controls compared to the other two treatment groups. P-value represents changes over time compared to the combined controls.

