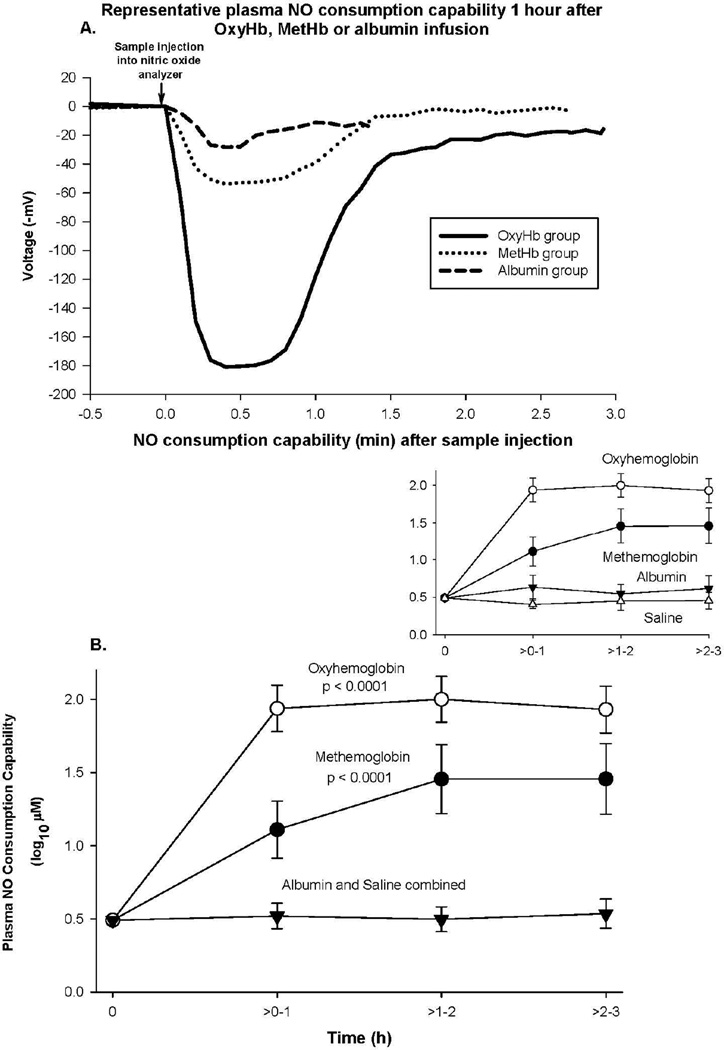
Figure 2. NO consumption.
Panel A represents plasma NO consumption capability obtained from animal 1 h after infusion of various Hb species or albumin. Panel B represents the format similar to Figure 1, except now mean (± SE) log10 NO consumption capability of plasma is plotted.

