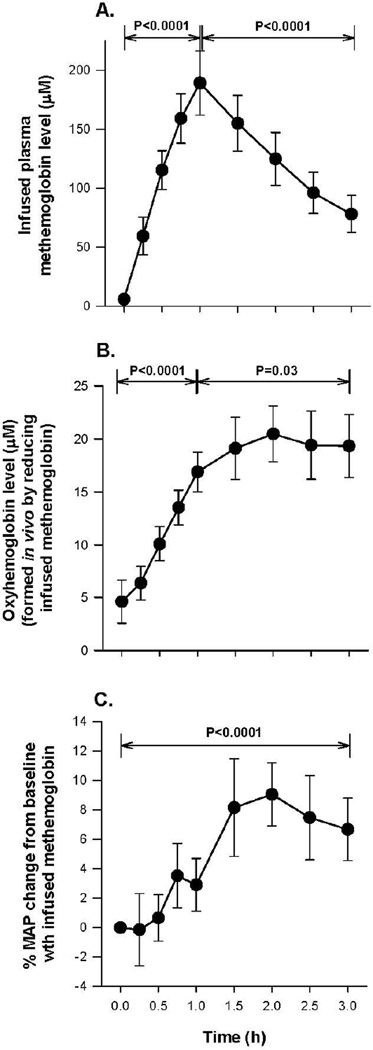
Figure 5. Hb species and percent changes in MAP during metHb infusions.
The format is the same as Figure 3, except now Hb species and percent changes in MAP are shown during the metHb infusion. Of note, Panel B now shows the cell-free fraction of metHb that was reduced to cell-free oxyHb during infusion.

