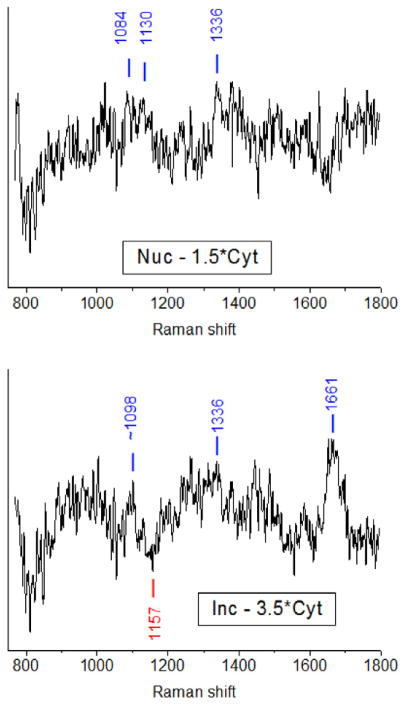
Fig. 4.
Raman difference spectra from the averaged spectra of Fig. 3. Left: subtraction of 1.5 times the cytoplasm spectrum from the nucleus spectrum. Right: subtraction of 3.5 times the cytoplasm spectrum from the inclusion spectrum. In both cases the subtraction parameter was chosen to remove the sharp 1004 cm−1 Phe line. The labeled peaks correspond to frequencies that appear both in the difference spectra and as resolved peaks in one or more of the averaged cell compartment spectra of Fig. 3.

