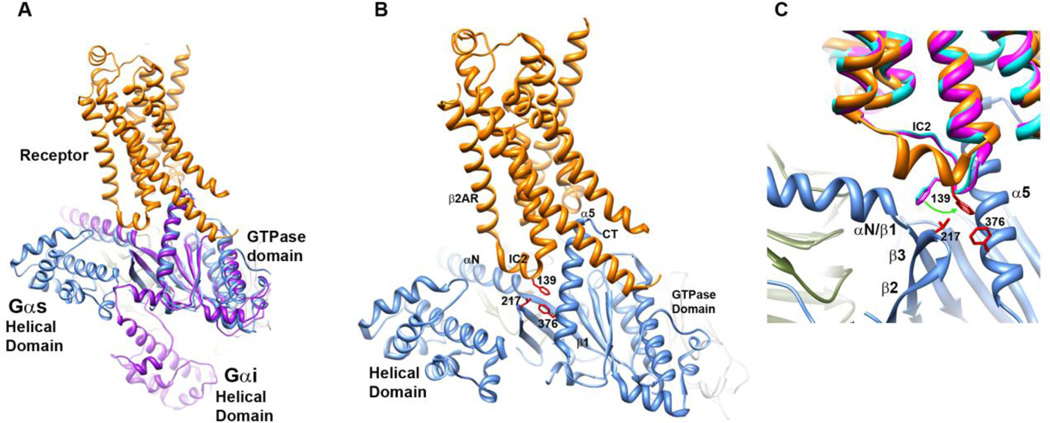
Fig. 1.
The receptor-G protein complex. A. Comparison of the positions of the helical domains of Gα in β2AR-Gs (β2AR in orange, Gs in blue) vs. model derived from32, shown in purple. B. Hydrophobic triad of residues links IC2 of the β2AR to the β2/β3 loop and CT α5 helix of Gαs in the receptor-bound complex, side chains from hydrophobic triad shown in red. C. Overlay of β2AR receptor (teal, bound to antagonist, no G protein, PDB 3NYA; magenta, bound to inverse agonist, no G protein, PDB 3D4S) with that of activated complex, PDB 3SN6 (as in B).

