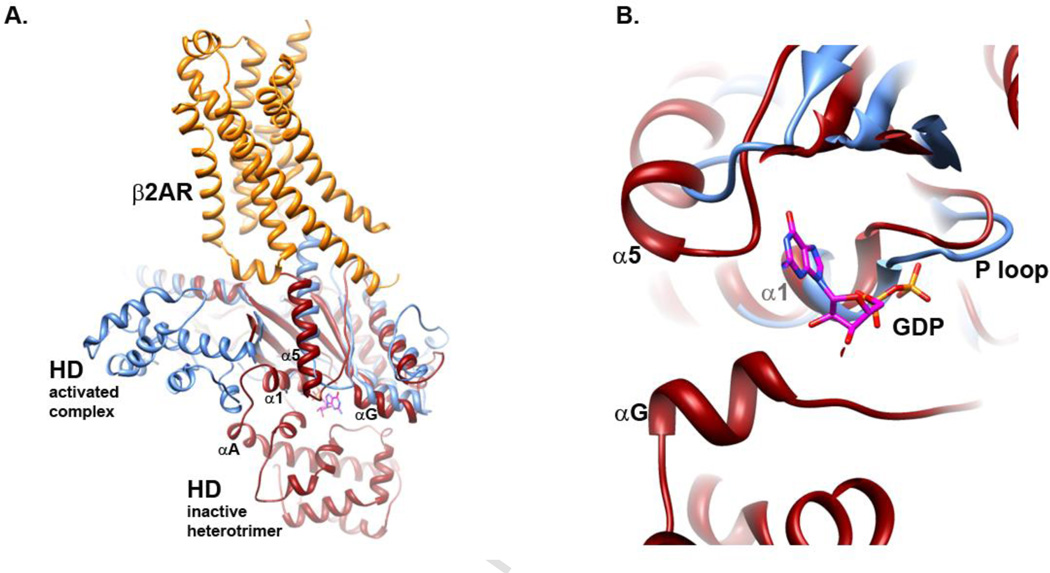
Fig. 2.
Overlay of β2AR-Gs complex with GDP-bound heterotrimeric G protein Gαβγi (PDB files 3SN6 and 1GP2, respectively). Gαs shown in blue, β2AR in orange, and Gαi in red. Note that there is no high resolution of GαsGDP available for this comparison. A. Overview showing proximity of α5, αA and αG helices to bound GDP (sticks). B. Close up, rotated and slab view, showing proximity of P loop, α5, αG and αA to bound nucleotide.

