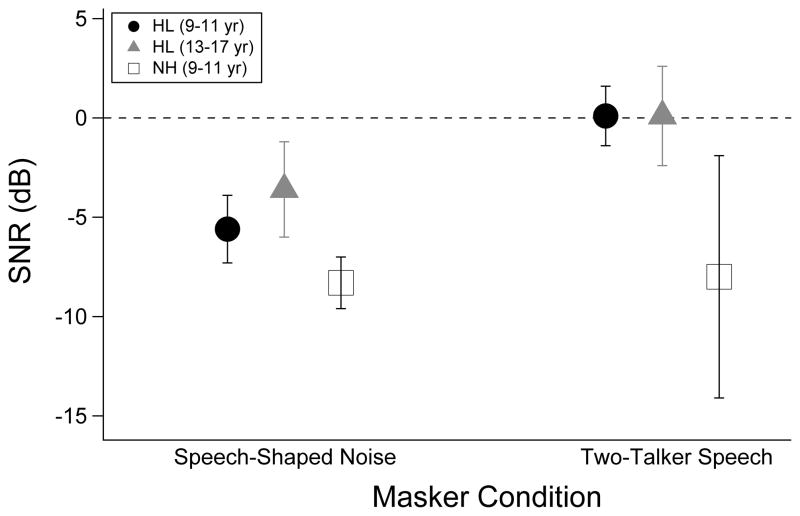
Figure 1.
Average SNRs at threshold across listeners (+/− 1 SD) are shown for each of the three groups (black circles for younger children with hearing loss, grey triangles for older children with hearing loss, and open squares for children with normal hearing). Data for the speech-shaped noise masker are presented to the left, and data for the two-talker speech masker are presented to the right. The dotted horizontal line indicates 0 dB SNR.

