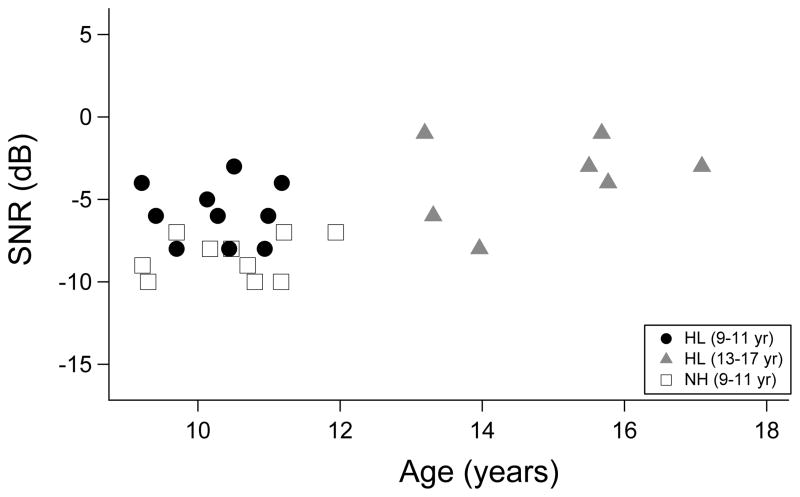
Figure 2.
Individual SNRs at threshold in the speech-shaped noise masker are plotted as a function of age. The black circles show SNRs for the 10 younger children with hearing loss, the grey triangles show SNRs for the 7 older children with hearing loss, and the open squares show SNRs for the 10 children with normal hearing.

