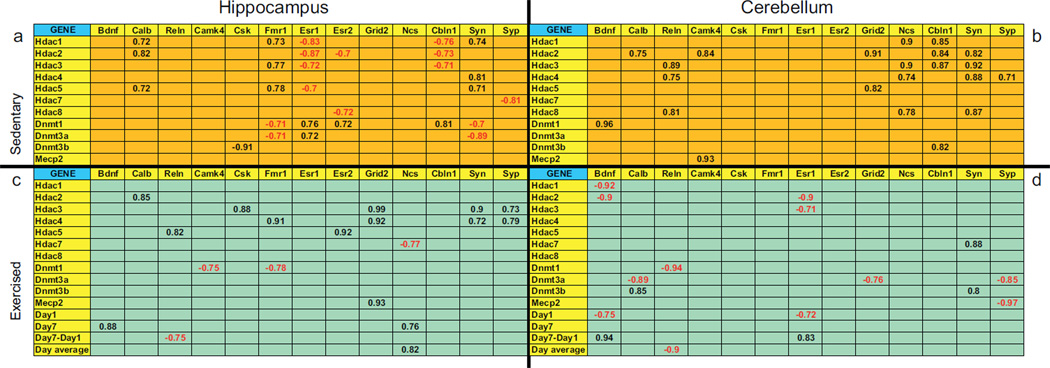
Table 5.
Correlations between gene expression levels of all structural and signaling genes versus epigenetic genes and distances ran (in the exercised group only) assessed by qRT-PCR in brains of adolescent male mice that were sedentary (n = 10) or exercised with voluntary wheel running (n = 9) for 1 week prior to sacrifice. Two brain regions were analyzed, the hippocampus and cerebellum. Correlations that were significant (p < 0.05) are presented in the table. Correlation values in red were negative and in black were positive.
 |
Bdnf = brain derived growth factor, Calb = calbindin d28k, Camk4 = calcium/calmodulin-dependent kinase 4, Cbln1 = cerebellin 1 precursor protein, Csk = csrc tyrosine kinase, Dnmt1 = DNA methyltransferase 1, Dnmt3a = DNA methyltransferase 3a, Dnmt3b = DNA methyltransferase 3b, Esr1 = estrogen receptor α, Esr2 = estrogen receptor β, Fmr1 = fragile X mental retardation protein, Grid2 = glutamate receptor, Hdac1 = histone deacetylase 1, Hdac2 = histone deacetylase 2, Hdac3 = histone deacetylase 3, Hdac4 = histone deacetylase 4, Hdac5 = histone deacetylase 5, Hdac7 = histone deacetylase 7, Hdac8 = histone deacetylase 8, Mecp2 = methyl CpG binding protein 2, Ncs = neuronal calcium sensor 1 Reln = reelin, Syn = synapsin, Syp = synaptophysin.
For exercised mice only Day 1 = average distance run on the first day of wheel exposure, Day 7 = average distance run on the seventh and final day of wheel exposure, Day 7–Day 1 = average difference in distance run on the first versus last day of wheel exposure, Day average = average distance run for all 7 days of wheel exposure.
