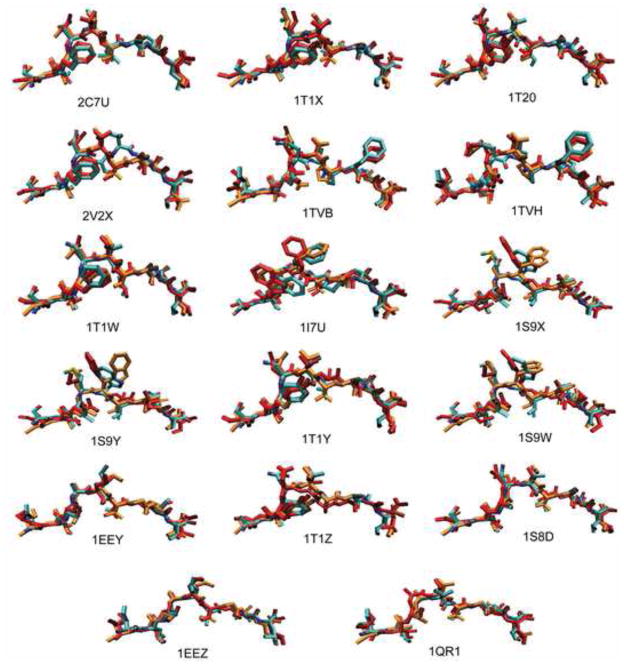
Figure 2.
Test set prediction. Superposition of the bound conformations of the antigenic peptides obtained from the X-ray crystal structures (cyan) with the MHC removed, the homology modeled peptides from MODELLER (orange), and the most frequent conformation obtained from simulation annealing trials (red).

