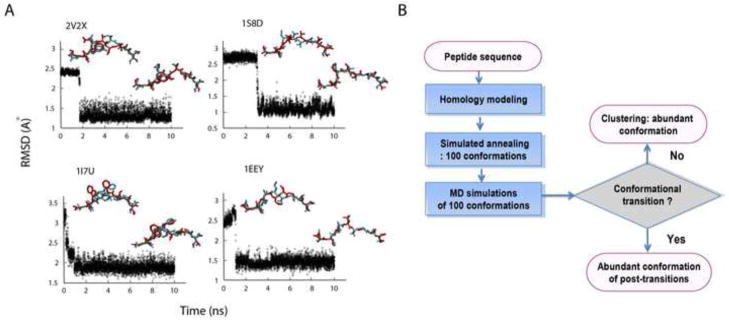
Figure 3.

Conformational transition. MD simulations reveal conformational transitions towards the correct configuration. A. The RMSD trajectories of the 2V2X, 1S8D, 1I7U, and 1EEY ligands during each run of the 10 ns MD simulation. Conformations of the pre- and post-transition (red) are compared to the x-ray structure (cyan). B. Summary of our prediction protocol.
