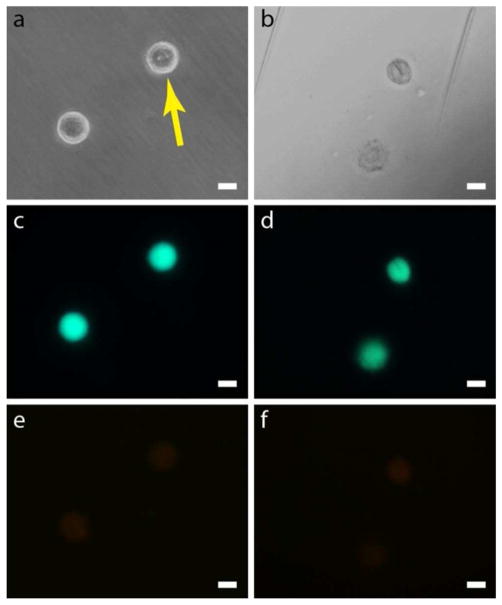
Figure 3.
Short-term cell viability results. a, Phase contrast image of two cells, one of which was poked by a nanoprobe (shown by the arrow) and one which was left untouched. b, Bright field image of two different cells, one which was loaded with a nanobeam and one which was left untouched. The nanobeam is the clear dark line in the upper cell. The cells look different compared to a because the microscope settings were changed to better visualize the cell interior. Also, the two parallel streaks are reference marks scratched into the petri dish with a metal probe to locate the treated cell. c, d, Green fluorescence from the calcein viability dye for the corresponding cells pictured in a and b. All cells show similar levels of green fluorescence intensity indicating the viability of both poked and loaded cells. In d it is even possible to see the outline of the loaded beam in the cell by an absence of color. e, f, Red fluorescence from the ethidium homodimer viability dye for the corresponding cells picture in a and b. The emission is very weak and uniform across all cells indicating the cell membranes were not compromised. Scale bars, 20 μm.

