Figure 4.
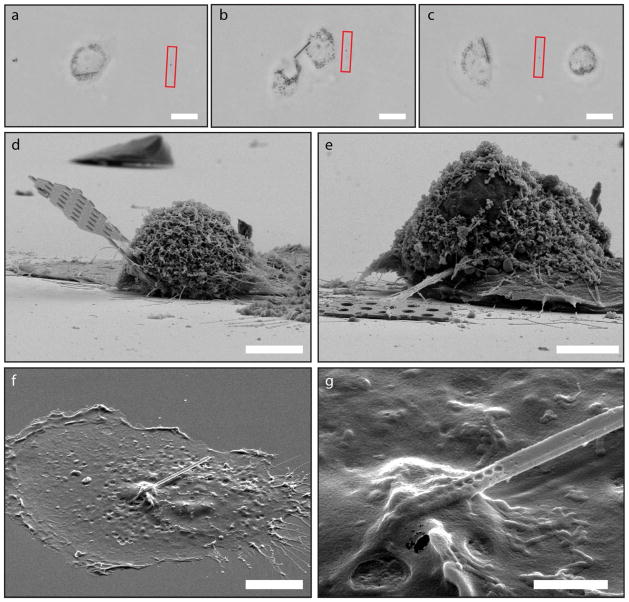
Nanobeam cell division and SEM images of loaded cells. a–c, Bright field images of a loaded cell prior (a), during (b), and after (c) cell division. Images were taken 30, 42, and 46 hours after loading the cell with the nanobeam, respectively. The red box indicated the position of the original scratch mark created during beam loading. This provides a reference mark for seeing how far the cells have migrated, which we observed to be up to 250 μm during the tracking period. d, SEM image of a nanobeam probe including part of the handle tip lodged inside a typical cell. A few flatter cells are seen in the background. e, SEM image of another cell pierced by a nanobeam with connected handle tip. f, SEM image of a cell that has only a beam inserted. This cell was not critical point dried and therefore is much flatter than the cells in d–e. g, Close-up of the entry point of the nanobeam into the cell in f. The holes that make up the cavity are clearly seen as they transition from fully visible outside of the cell to being hidden under the cell membrane. Scale bars: 20 μm (a–c), 5 μm (d–e), 10 μm (f), 2 μm (g).

