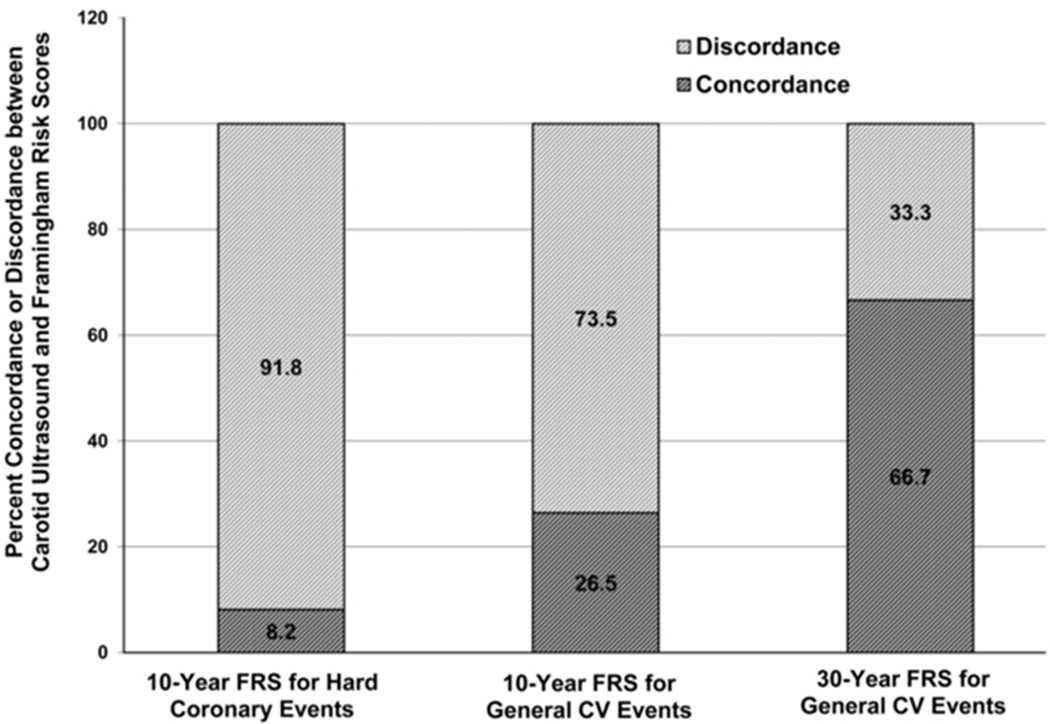
Figure 3.
Percent concordance and discordance between abnormal carotid ultrasound findings and Framingham risk Scores (FRS). Numbers represent percent of participants in each category of the FRS with abnormal carotid ultrasound findings and concordant or discordant Framingham risk classification. Chi square test for trend showed a significant difference in concordance between abnormal carotid ultrasound findings and the different FRS, being highest for the 30-year FRS for general cardiovascular events (p=0.018).

