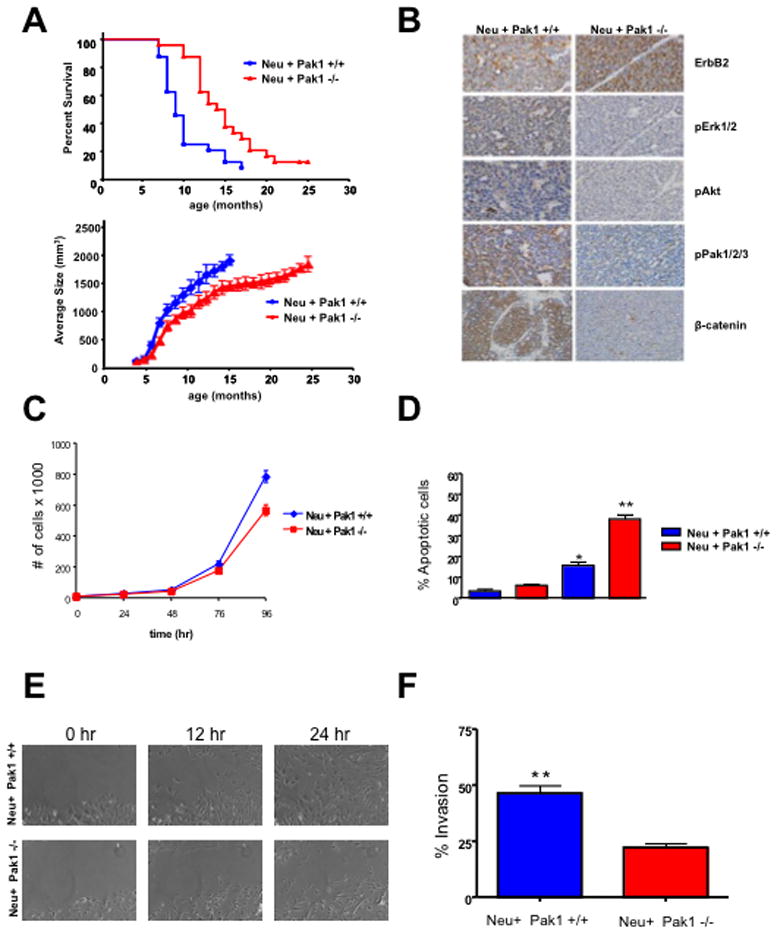
Figure 3. Pak1 deficiency delays tumorigenesis and impacts proliferation, survival, migration and invasion of ErbB2/neu-expressing tumor cells.

(A), Kaplan-Meier curve (upper panel) indicate significant increase in latency of tumor formation in MMTV-Neu:Pak1−/− (n = 22) versus MMTV-Neu:Pak1+/+ (n = 21) mice (P = 0.0015). Reduced tumor burden (lower panel) in MMTV-Neu:Pak1−/− mice (p<0.0001) (B) Representative example of MMTV-Neu:Pak1+/+ and MMTV-Neu:Pak1−/− breast cancer specimens stained for ErbB2, phospho-ERK, phospho-Akt, β-catenin, and phospho-Pak. (C) Proliferation of MMTV-Neu:Pak1+/+ and MMTV-Neu:Pak1−/− tumor derived cells. Cells were seeded, harvested and counted at 0, 24, 48, 72 and 96 h. The data are representative of three independent experiments. Points, mean; bars, SD. (D) Apoptosis of MMTV-Neu:Pak1+/+ and MMTV-Neu:Pak1−/− tumor derived cells. Apoptosis was measured calculating the percent of positive Annexin V-PE cells by flow cytometry. The data are representative of three independent experiments. Bars, SD. (E) in vitro scratch assay using MMTV-Neu:Pak1+/+ and MMTV-Neu:Pak1−/− tumor derived cells. (F) Matrigel invasion assay using MMTV-Neu:Pak1+/+ and MMTV-Neu:Pak1−/− tumor derived cells. The data are representative of three independent experiments. Bars, SD.
