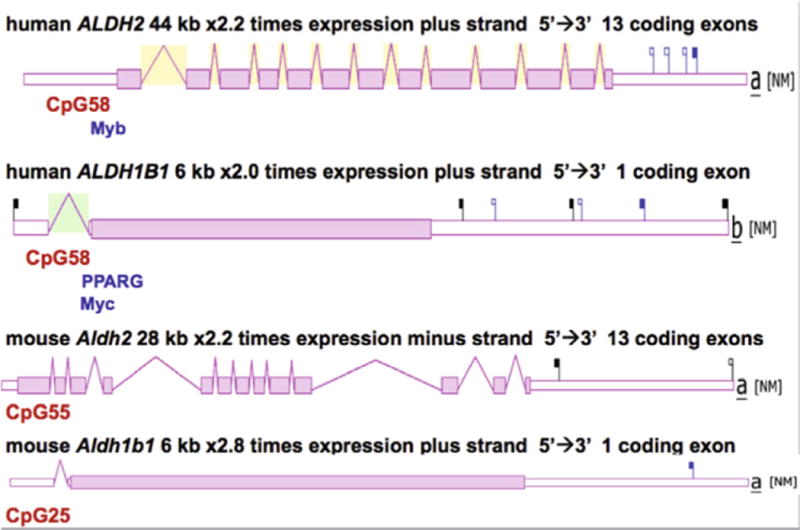
Fig. 2.

Comparative structures for human and mouse ALDH2 and ALDH1B1 genes. Data are derived from the AceView website (http://www.ncbi.nlm.nih.gov/IEB/Research/Acembly/). The major isoform for each gene is shown, with capped 5′- and 3′-ends for the predicted mRNA sequences. Introns and coding exons are shown. Note the differences in scale for the ALDH2 (44 or 28 kbs) and ALDH1B1 (both 6 kbs) genes. Coding exons are depicted as pink (or shaded) bars and untranslated 5′ and 3′ regions are shown as white bars. CpG islands located in the 5′-promoter regions are labeled. The location of predicted binding sites for the transcription factors Myb, Myc and PPARG in the promoter region for the human genes are also presented. Comparative expression levels are shown as (×) times the average expression level; NM refers to the NCBI RefSeq sequence. Flags depict the 3′UTR polyadenylation sites. Black flags indicate the typical AATAAA signal, and blue flags indicate a SNP variant of this signal. Filled flags correspond to events with many supporting cDNAs, and empty flags indicate fewer supporting cDNAs.
