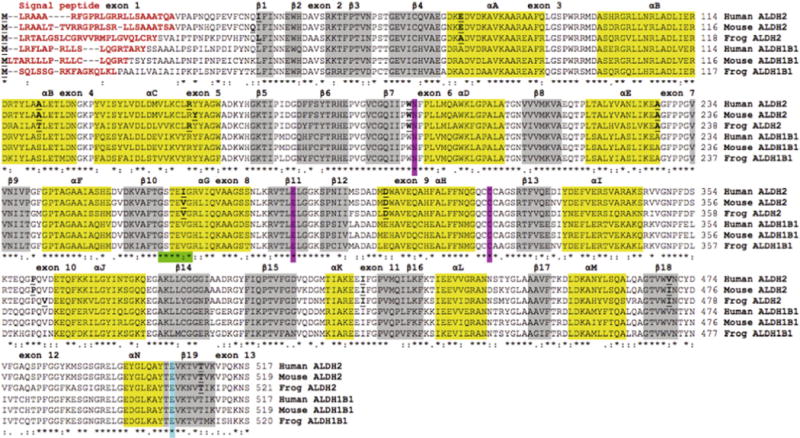
Fig. 3.

Amino acid sequence alignments for human, mouse and frog ALDH2 and ALDH1B1 sequences. See Tables 1 and 2 for sources of ALDH1B1 and ALDH2 sequences, respectively. Symbols below all of the sequences describe the similarities in the amino acids across the sequences at each position and denotes them as being identical (*), highly similar (:) or less similar (.). Residues with no symbols have no similarity. Key functional residues include N-signal peptide residues (red text or bold) and the active site triad residues Asn; Glu; and Cys (pink shading or AS). Predicted secondary structural regions, shown as α-helix (yellow shading or black shading) and β-sheet (grey shading), are based on [25,26] for human ALDH2. Known or predicted exon junctions are identified by underlined bold font, with exon numbers referring to the human ALDH2 gene. Other important enzyme regions, including the NAD+ binding domain (green shading or shaded ****:*) and the ALDH2*2 variant position (blue shading or #) are shown.(For interpretation of the references to colour in this figure legend, the reader is referred to the web version of this article.)
