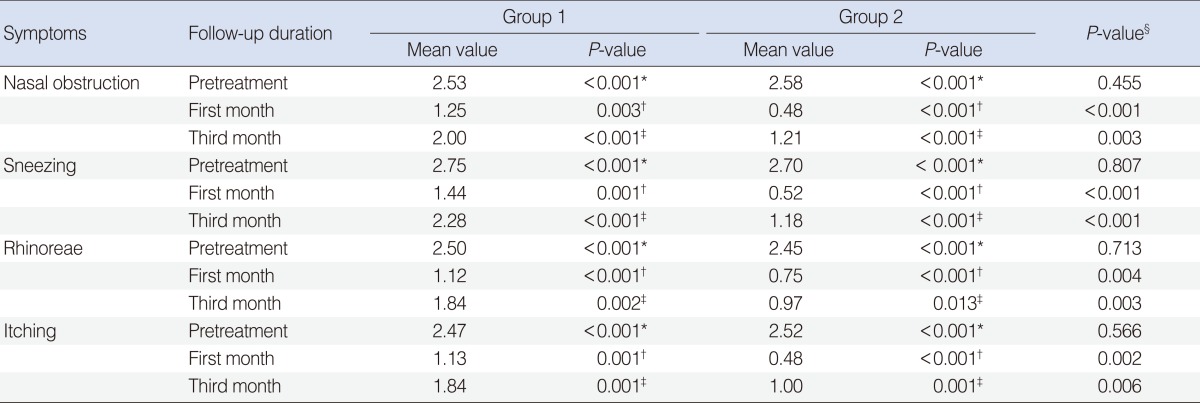
Table 1.
Mean values of symptom scores before treatment and after treatment at both 1st and 3rd months for each groups and P-value between the groups and within the groups

*P-value between pretreatment and 1st month within the group 1 and group 2. †P-value between pretreatment and 3rd month within the group 1 and group 2. ‡P-value between 1st and 3rd month within the group 1 and group 2. §P-values between the groups.
