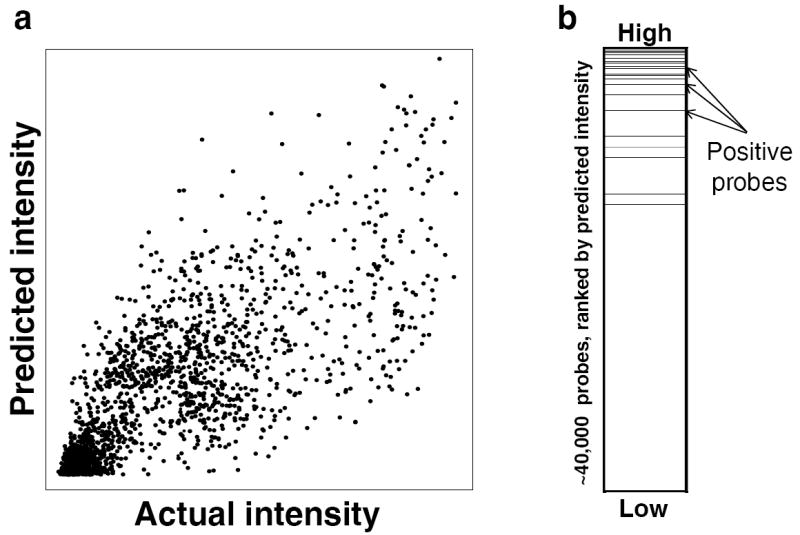
Figure 1.

Evaluation criteria used in this study. For each TF, we scored an algorithm’s probe intensity predictions using two evaluation criteria, which are illustrated here for TF_16 (Prdm11), using the predictions of BEEML-PBM on the raw array intensity data. (a) Pearson correlation between predicted and actual probe intensities across all ~40,000 probes. (b) Area under the receiver operating characteristic curve (AUROC) of the set of positive probes. Positive probes (black dashed lines) were defined as all probes on the test array with intensities greater than four standard deviations above the mean probe intensity for the given array.
