
Figure 3.
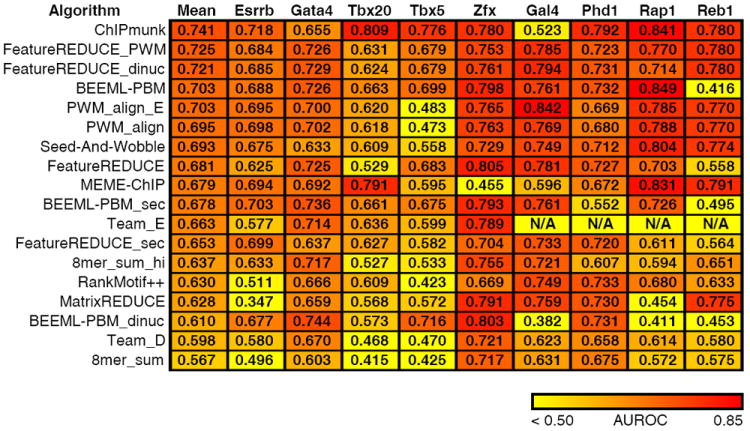
Comparison of algorithm performance on in vivo data. For each algorithm, we learned a model (PMW, k-mer or dinucleotide) using PBM data, and gauged its ability to discriminate real from random ChIP peaks using the AUROC (Online Methods). Data for the first five TFs were taken from mouse ChIP-seq data. The final four are from yeast ChIP-exo data. The color scale is indicated at the bottom. Team_E was not run on the ChIP-exo data, because it requires initialization parameters specific to the individual TF. FeatureREDUCE was run using models of length 8, instead of length 10, owing to the superior performance of this length model on in vivo data (T.R. Riley and H.J. Bussemaker, manuscript in preparation).