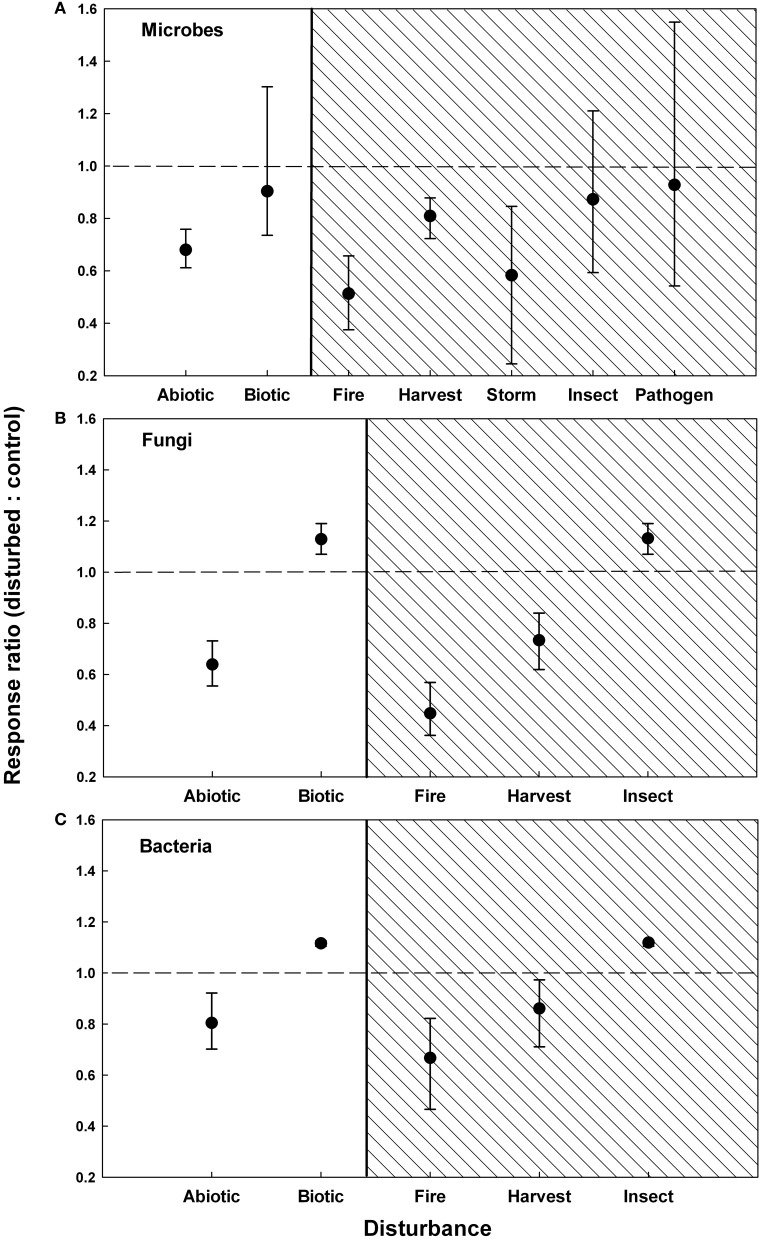
Figure 1.
Responses of microbial biomass (A), fungal abundance (B), and bacterial abundance (C) to forest disturbances. Response ratios are grouped by abiotic and biotic disturbances (unshaded) and by disturbance type (shaded). Symbols are means ± 95% confidence intervals. A response ratio < 1 indicates that microbial abundances declined following disturbance, a response ratio > 1 indicates an increase in microbial biomass.

