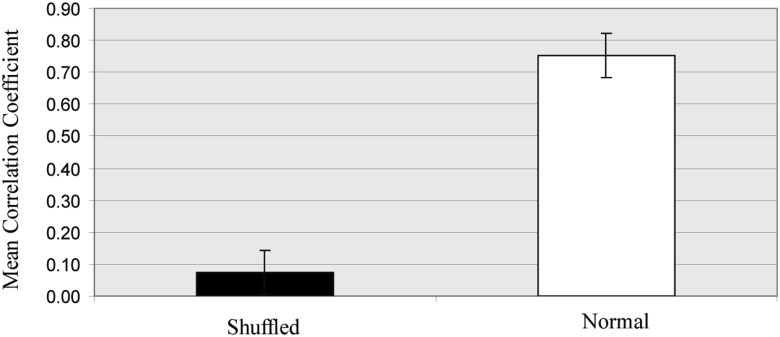
Figure 11.
Correlation coefficients of the normal and shuffled data. Bars show the mean and standard deviation of the correlation coefficients achieved by all ANN models when either the normal (white) or randomly shuffled (black) expression profiles for the target gene where used to train the models.

