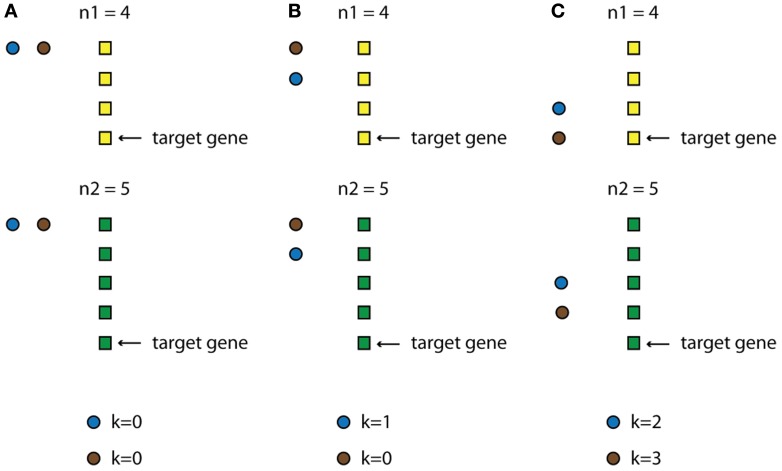
Figure 3.
Schematic example of how the TF-delay table is constructed. Assume a category that consists of two conditions, with n1 and n2 time points, respectively (black and white rectangles), and a module that, for simplicity, is regulated by two upper-layer TFs (black and gray circles). The condition with the smallest number of time points is n1 so this will be the “leading” condition. Imagine that the target gene is expressed at time point n1 = 4 (This ranges from 1 to 4, since the expression profile of the gene is also shifted in time). Every TF is allowed to be expressed at the time points 1, 2, 3, and 4 (k represents the steps that each TF is shifted). (A) Both TFs are expressed at time point 1 (k = 0). (B) The first (black) TF is expressed at time point 2 (k = 1) while the second (gray) at time point 1 (k = 0). (C) The first (black) TF is expressed at time point 3 (k = 2) while the second (gray) at time point 4 (k = 3).

