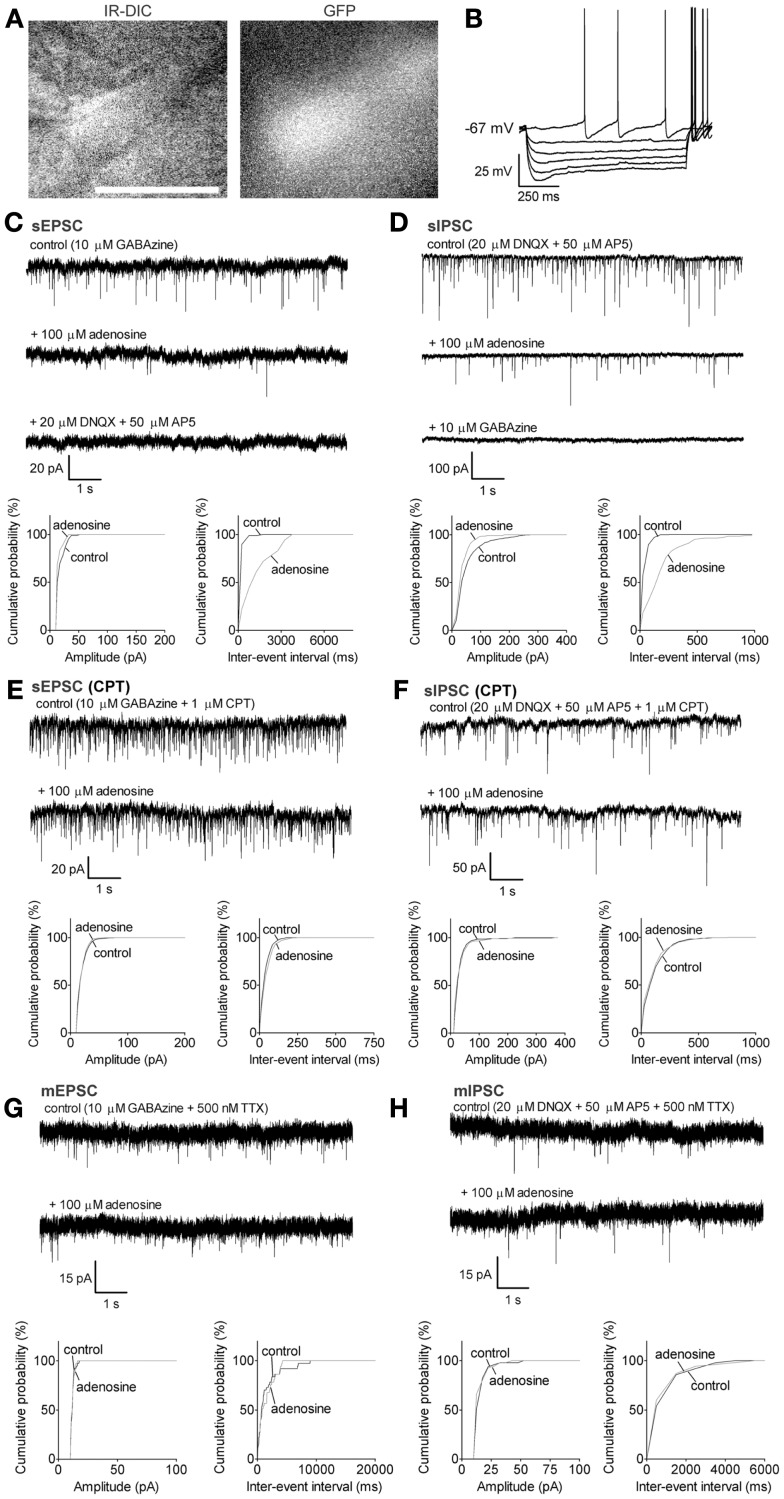
Figure 3.
Adenosine significantly decreases the frequency of sEPSC and sIPSC via A1 receptors GABAergic neurons with a small Ih. (A) Infrared-differential interference microscopy (IR-DIC) and black-and-white fluorescent images of a typical GABAergic neuron with a small Ih. Scale bar: 25 μm. GABAergic neurons were distinguished from cholinergic neurons by their GFP-positive pattern under fluorescent illumination and identified by their typical intrinsic membrane properties during current pulses (B) −300 to 0, −60 pA interval. GABAergic neurons with a small Ih were spontaneously active, and exhibited small depolarizing sags during hyperpolarizing current pulses and small afterhyperpolarizations when depolarized. (C) Adenosine reduced the frequency but not the amplitude of spontaneous excitatory postsynaptic currents (sEPSC). The GABAA receptor antagonist, GABAzine, was used to isolate excitatory events. Holding potential was −60 mV. (D) Adenosine reduced the frequency but not the amplitude of spontaneous inhibitory postsynaptic currents (sIPSC). The ionotropic glutamate receptor antagonists, DNQX and AP5 were used to isolate inhibitory synaptic events. A KCl-based intracellular solution and a holding potential of −90 mV were used to enhance the driving force for chloride. KCl-based intracellular solution shifted the reversal potential in the depolarizing direction, thus the recorded currents are inward going. (E) The adenosine A1 receptor antagonist, 1 μM CPT, blocked the effect of adenosine on sEPSCs. (F) CPT blocked the effect of adenosine on sIPSCs. (G) Adenosine did not affect the frequency or amplitude of miniature excitatory postsynaptic currents (mEPSCs), recorded in the presence of tetrodotoxin (TTX) and GABAzine. (H) Adenosine did not affect the frequency or amplitude of miniature inhibitory postsynaptic currents (mIPSCs), recorded in the presence of TTX, DNQX, and AP5. (C–H) Top traces: 10 s-long representative traces from one neuron under each recording condition. Bottom graphs: cumulative probability histograms of amplitude (left) and inter-event interval (right) of 1 min recordings from the same neuron. Distributions were compared using the Kolmogorov–Smirnov test.

