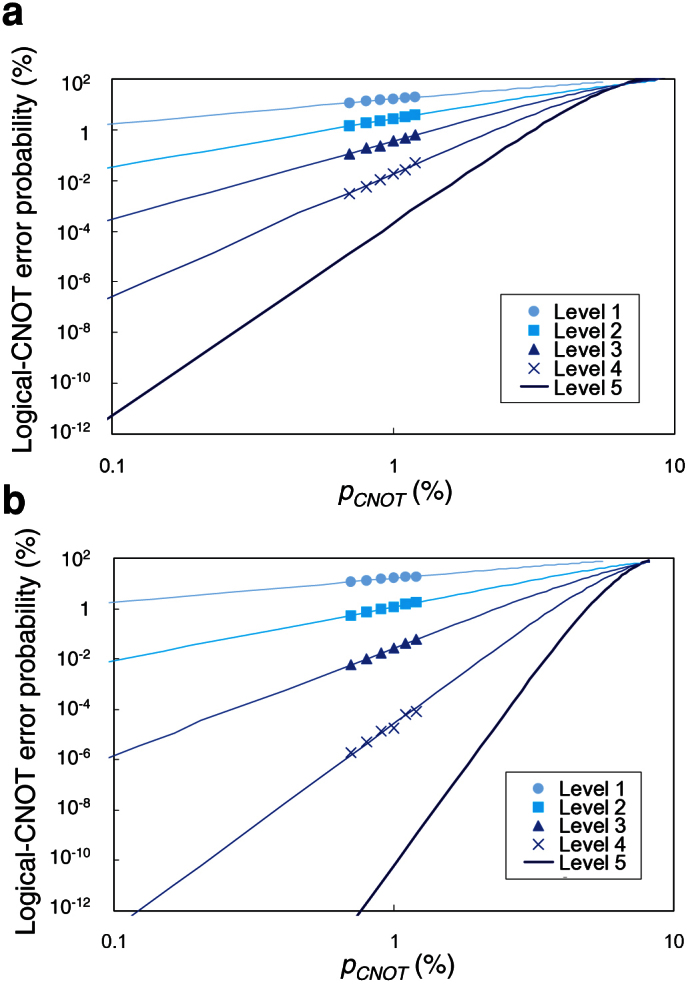
Figure 3. Logical-CNOT error probability.

(a) and (b) correspond to the hard-decision and soft-decision decoders, respectively. The symbols (circle, square, triangle, and cross) are the simulation results. The curves were estimated with the results for the depolarizing channel (see the text). Different symbols (colors) correspond to different concatenation levels and the lowest bold lines correspond to level 5, as shown in the figures.
