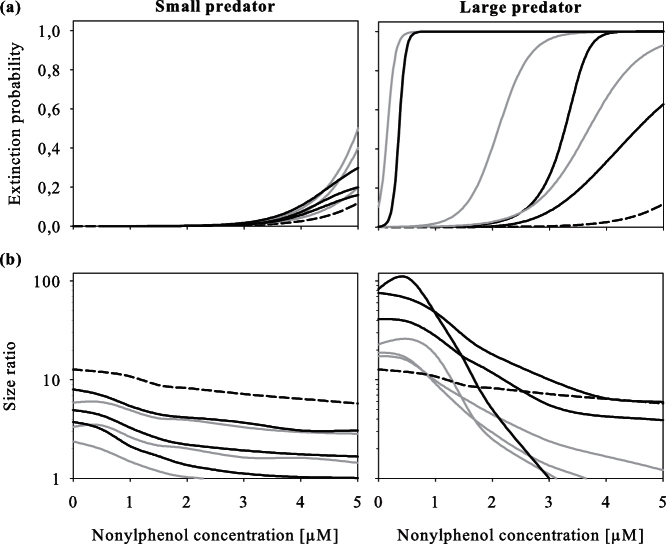
Figure 4. Extinction probability (a) and size ratio (b) in Daphnia magna populations as functions of nonlyphenol concentration simulated without (grey solid lines) and with (black solid lines) consideration of kairomone effects.
Endpoints were calculated for small (1st instar, left panel) and large (5th instar, right panel) Notonecta maculata. Increasing line weight corresponds to increasing predation intensities (1–3 N. maculata specimens per system), with dashed lines representing simulations without predation. Extinction probabilities were recorded 10 days after initializing a 2-day pulse exposure and effects on population size-structure (mean of 100 Monte-Carlo simulations) 3 days after initializing exposure.

