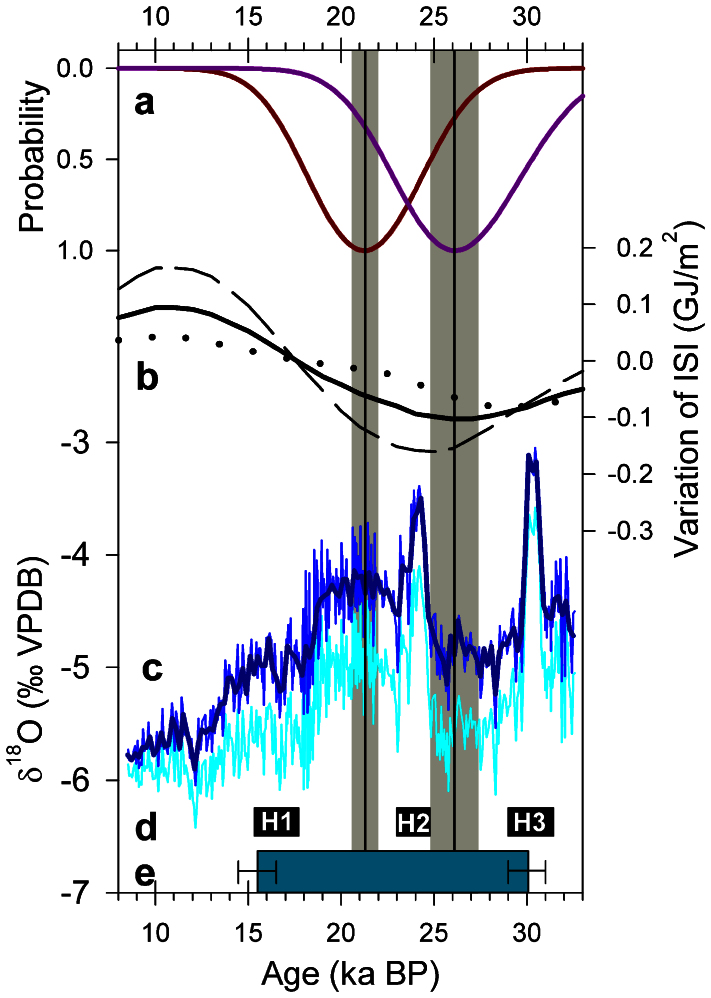
Figure 3. Chronology of the PD in the Central Spain paleoglaciers and paleoclimate setting.
(a) Probability distribution functions of the 10Be ages for the two stages. Black vertical lines represent the stage ages with the grey vertical bars being the standard error of the mean. (b) ISI variability for 40°N18 for most likely τ configurations; τ = 325 (dashed); 350 (solid) and 375 (dotted). (c) Eagle Cave δ18O record (light blue) and ice volume corrected δ18O record (dark blue) with a 0.2 ka filter (bold blue). The isotope ratio correction takes into account sea level changes by Peltier and Fairbanks37 considering a rate of change of 0.06‰/10 m of sea level38. (d) Black rectangles labelled H1 to H3 refer to Heinrich events39. (e) Green rectangle corresponds with the period of lack of calcite deposition in Villars Cave (southern France) due to extreme cold conditions21. Error bars indicate U-Th ages uncertainty.

