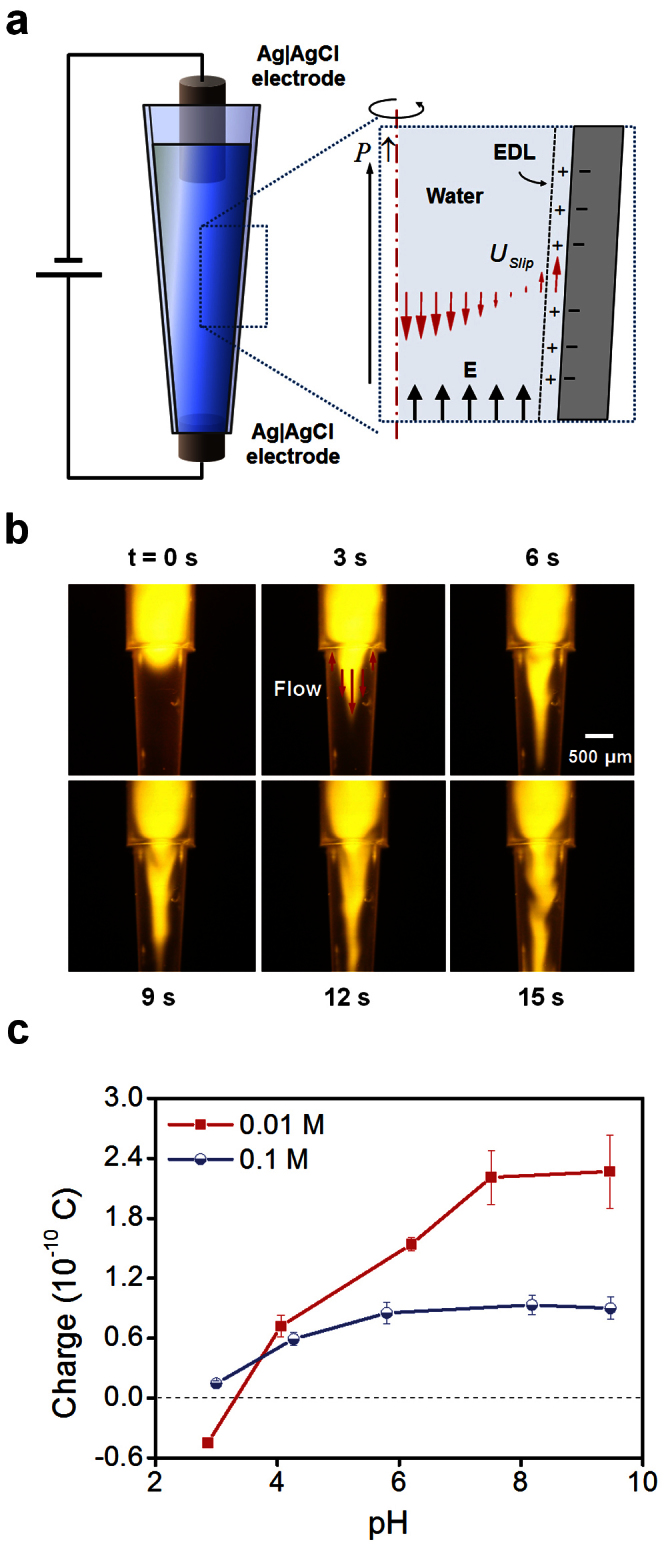
Figure 5. Visualization of electroosmotic flow inside a pipette tip and the effect of pH on the charge of a droplet.

(a) Numerical modeling of the electroosmotic flow (b) Electroosmotic flow visualization using fluorescent dye (Rhodamine 6G). Ag|AgCl electrodes were used to avoid electrolysis; distance between electrodes 18 mm; applied voltage 30 V. (c) Effects of pH on charges of 7-μL droplets (RH = 50%).
